Paiute vs Immigrants from Ecuador Single Father Households
COMPARE
Paiute
Immigrants from Ecuador
Single Father Households
Single Father Households Comparison
Paiute
Immigrants from Ecuador
3.3%
SINGLE FATHER HOUSEHOLDS
0.0/ 100
METRIC RATING
336th/ 347
METRIC RANK
2.4%
SINGLE FATHER HOUSEHOLDS
14.9/ 100
METRIC RATING
216th/ 347
METRIC RANK
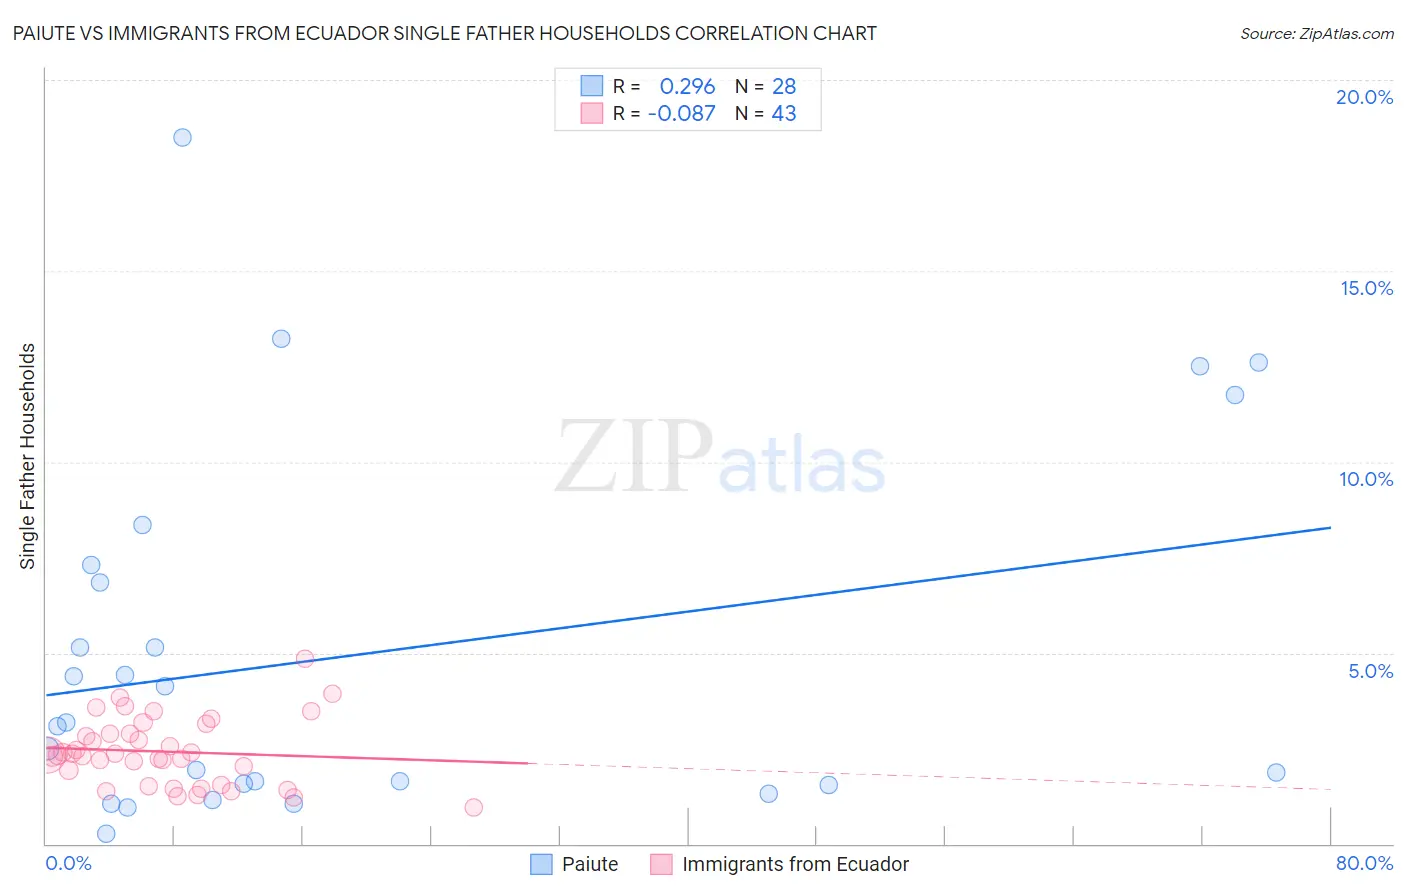
Paiute vs Immigrants from Ecuador Single Father Households Correlation Chart
The statistical analysis conducted on geographies consisting of 58,300,881 people shows a weak positive correlation between the proportion of Paiute and percentage of single father households in the United States with a correlation coefficient (R) of 0.296 and weighted average of 3.3%. Similarly, the statistical analysis conducted on geographies consisting of 269,379,294 people shows a slight negative correlation between the proportion of Immigrants from Ecuador and percentage of single father households in the United States with a correlation coefficient (R) of -0.087 and weighted average of 2.4%, a difference of 36.6%.
Single Father Households Correlation Summary
| Measurement | Paiute | Immigrants from Ecuador |
| Minimum | 0.27% | 0.94% |
| Maximum | 18.5% | 4.9% |
| Range | 18.2% | 3.9% |
| Mean | 5.0% | 2.4% |
| Median | 3.1% | 2.3% |
| Interquartile 25% (IQ1) | 1.6% | 1.5% |
| Interquartile 75% (IQ3) | 7.1% | 2.9% |
| Interquartile Range (IQR) | 5.5% | 1.4% |
| Standard Deviation (Sample) | 4.7% | 0.87% |
| Standard Deviation (Population) | 4.7% | 0.86% |
Similar Demographics by Single Father Households
Demographics Similar to Paiute by Single Father Households
In terms of single father households, the demographic groups most similar to Paiute are Colville (3.3%, a difference of 0.030%), Yuman (3.3%, a difference of 0.050%), Pueblo (3.3%, a difference of 0.26%), Sioux (3.3%, a difference of 0.94%), and Alaskan Athabascan (3.4%, a difference of 2.4%).
| Demographics | Rating | Rank | Single Father Households |
| Chippewa | 0.0 /100 | #329 | Tragic 3.1% |
| Nepalese | 0.0 /100 | #330 | Tragic 3.1% |
| Navajo | 0.0 /100 | #331 | Tragic 3.2% |
| Yaqui | 0.0 /100 | #332 | Tragic 3.2% |
| Natives/Alaskans | 0.0 /100 | #333 | Tragic 3.2% |
| Yuman | 0.0 /100 | #334 | Tragic 3.3% |
| Colville | 0.0 /100 | #335 | Tragic 3.3% |
| Paiute | 0.0 /100 | #336 | Tragic 3.3% |
| Pueblo | 0.0 /100 | #337 | Tragic 3.3% |
| Sioux | 0.0 /100 | #338 | Tragic 3.3% |
| Alaskan Athabascans | 0.0 /100 | #339 | Tragic 3.4% |
| Alaska Natives | 0.0 /100 | #340 | Tragic 3.5% |
| Crow | 0.0 /100 | #341 | Tragic 3.5% |
| Tohono O'odham | 0.0 /100 | #342 | Tragic 3.8% |
| Pima | 0.0 /100 | #343 | Tragic 4.2% |
Demographics Similar to Immigrants from Ecuador by Single Father Households
In terms of single father households, the demographic groups most similar to Immigrants from Ecuador are Dutch (2.4%, a difference of 0.090%), Immigrants from South Eastern Asia (2.4%, a difference of 0.13%), Immigrants from Ethiopia (2.4%, a difference of 0.22%), Ethiopian (2.4%, a difference of 0.23%), and Norwegian (2.4%, a difference of 0.29%).
| Demographics | Rating | Rank | Single Father Households |
| Immigrants | Peru | 19.3 /100 | #209 | Poor 2.4% |
| Immigrants | Costa Rica | 19.2 /100 | #210 | Poor 2.4% |
| Immigrants | Nigeria | 18.7 /100 | #211 | Poor 2.4% |
| Finns | 18.3 /100 | #212 | Poor 2.4% |
| Norwegians | 17.1 /100 | #213 | Poor 2.4% |
| Ethiopians | 16.6 /100 | #214 | Poor 2.4% |
| Immigrants | South Eastern Asia | 15.9 /100 | #215 | Poor 2.4% |
| Immigrants | Ecuador | 14.9 /100 | #216 | Poor 2.4% |
| Dutch | 14.3 /100 | #217 | Poor 2.4% |
| Immigrants | Ethiopia | 13.4 /100 | #218 | Poor 2.4% |
| Sudanese | 13.0 /100 | #219 | Poor 2.4% |
| Ghanaians | 12.9 /100 | #220 | Poor 2.4% |
| Immigrants | Burma/Myanmar | 12.1 /100 | #221 | Poor 2.4% |
| Immigrants | Eastern Africa | 11.9 /100 | #222 | Poor 2.4% |
| Immigrants | Uruguay | 11.0 /100 | #223 | Poor 2.4% |