Paiute vs Immigrants from Croatia Associate's Degree
COMPARE
Paiute
Immigrants from Croatia
Associate's Degree
Associate's Degree Comparison
Paiute
Immigrants from Croatia
36.4%
ASSOCIATE'S DEGREE
0.0/ 100
METRIC RATING
329th/ 347
METRIC RANK
50.2%
ASSOCIATE'S DEGREE
98.9/ 100
METRIC RATING
86th/ 347
METRIC RANK
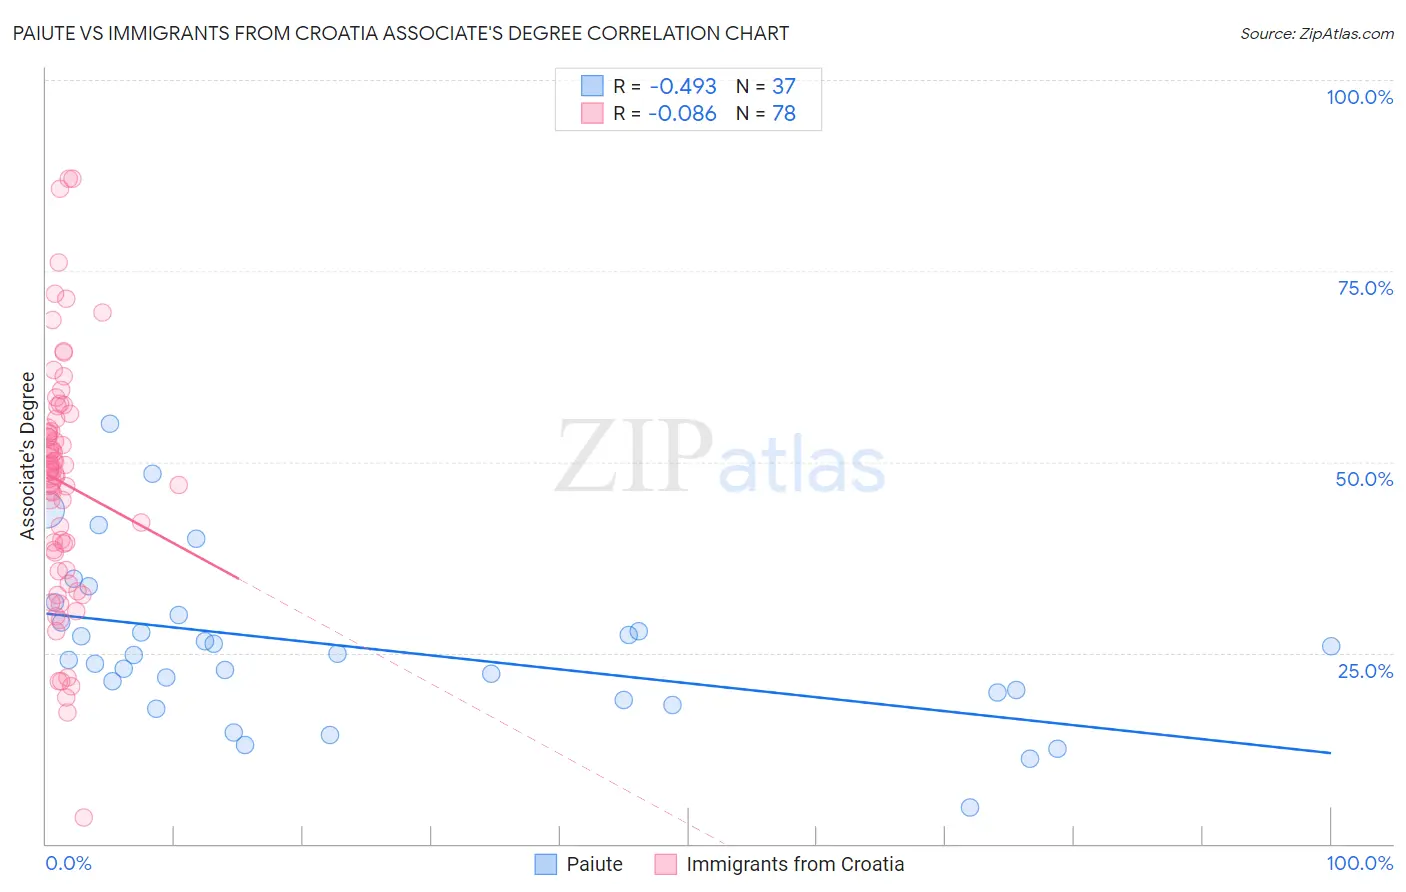
Paiute vs Immigrants from Croatia Associate's Degree Correlation Chart
The statistical analysis conducted on geographies consisting of 58,403,115 people shows a moderate negative correlation between the proportion of Paiute and percentage of population with at least associate's degree education in the United States with a correlation coefficient (R) of -0.493 and weighted average of 36.4%. Similarly, the statistical analysis conducted on geographies consisting of 132,578,161 people shows a slight negative correlation between the proportion of Immigrants from Croatia and percentage of population with at least associate's degree education in the United States with a correlation coefficient (R) of -0.086 and weighted average of 50.2%, a difference of 38.1%.
Associate's Degree Correlation Summary
| Measurement | Paiute | Immigrants from Croatia |
| Minimum | 4.8% | 3.4% |
| Maximum | 54.9% | 87.1% |
| Range | 50.2% | 83.7% |
| Mean | 25.6% | 47.3% |
| Median | 24.7% | 48.7% |
| Interquartile 25% (IQ1) | 19.3% | 38.1% |
| Interquartile 75% (IQ3) | 29.4% | 54.3% |
| Interquartile Range (IQR) | 10.1% | 16.2% |
| Standard Deviation (Sample) | 10.4% | 15.9% |
| Standard Deviation (Population) | 10.3% | 15.8% |
Similar Demographics by Associate's Degree
Demographics Similar to Paiute by Associate's Degree
In terms of associate's degree, the demographic groups most similar to Paiute are Alaskan Athabascan (36.5%, a difference of 0.29%), Dutch West Indian (36.5%, a difference of 0.30%), Apache (36.2%, a difference of 0.31%), Kiowa (36.5%, a difference of 0.32%), and Menominee (36.7%, a difference of 0.88%).
| Demographics | Rating | Rank | Associate's Degree |
| Pennsylvania Germans | 0.0 /100 | #322 | Tragic 37.2% |
| Immigrants | Cabo Verde | 0.0 /100 | #323 | Tragic 36.8% |
| Arapaho | 0.0 /100 | #324 | Tragic 36.7% |
| Menominee | 0.0 /100 | #325 | Tragic 36.7% |
| Kiowa | 0.0 /100 | #326 | Tragic 36.5% |
| Dutch West Indians | 0.0 /100 | #327 | Tragic 36.5% |
| Alaskan Athabascans | 0.0 /100 | #328 | Tragic 36.5% |
| Paiute | 0.0 /100 | #329 | Tragic 36.4% |
| Apache | 0.0 /100 | #330 | Tragic 36.2% |
| Immigrants | Azores | 0.0 /100 | #331 | Tragic 35.6% |
| Immigrants | Central America | 0.0 /100 | #332 | Tragic 35.0% |
| Mexicans | 0.0 /100 | #333 | Tragic 35.0% |
| Natives/Alaskans | 0.0 /100 | #334 | Tragic 34.9% |
| Spanish American Indians | 0.0 /100 | #335 | Tragic 34.9% |
| Hopi | 0.0 /100 | #336 | Tragic 34.6% |
Demographics Similar to Immigrants from Croatia by Associate's Degree
In terms of associate's degree, the demographic groups most similar to Immigrants from Croatia are Immigrants from Egypt (50.2%, a difference of 0.010%), Immigrants from Hungary (50.2%, a difference of 0.060%), Immigrants from Uzbekistan (50.3%, a difference of 0.080%), Greek (50.3%, a difference of 0.12%), and Immigrants from Moldova (50.2%, a difference of 0.12%).
| Demographics | Rating | Rank | Associate's Degree |
| Ethiopians | 99.1 /100 | #79 | Exceptional 50.4% |
| Armenians | 99.1 /100 | #80 | Exceptional 50.4% |
| Maltese | 99.1 /100 | #81 | Exceptional 50.4% |
| Greeks | 98.9 /100 | #82 | Exceptional 50.3% |
| Immigrants | Uzbekistan | 98.9 /100 | #83 | Exceptional 50.3% |
| Immigrants | Hungary | 98.9 /100 | #84 | Exceptional 50.2% |
| Immigrants | Egypt | 98.9 /100 | #85 | Exceptional 50.2% |
| Immigrants | Croatia | 98.9 /100 | #86 | Exceptional 50.2% |
| Immigrants | Moldova | 98.8 /100 | #87 | Exceptional 50.2% |
| Immigrants | Canada | 98.7 /100 | #88 | Exceptional 50.1% |
| Immigrants | Western Europe | 98.7 /100 | #89 | Exceptional 50.1% |
| Immigrants | Ethiopia | 98.7 /100 | #90 | Exceptional 50.1% |
| Immigrants | Western Asia | 98.7 /100 | #91 | Exceptional 50.1% |
| Immigrants | North America | 98.7 /100 | #92 | Exceptional 50.1% |
| Immigrants | Brazil | 98.5 /100 | #93 | Exceptional 50.0% |