Ottawa vs South American Indian Currently Married
COMPARE
Ottawa
South American Indian
Currently Married
Currently Married Comparison
Ottawa
South American Indians
46.5%
CURRENTLY MARRIED
43.0/ 100
METRIC RATING
181st/ 347
METRIC RANK
45.8%
CURRENTLY MARRIED
11.5/ 100
METRIC RATING
205th/ 347
METRIC RANK
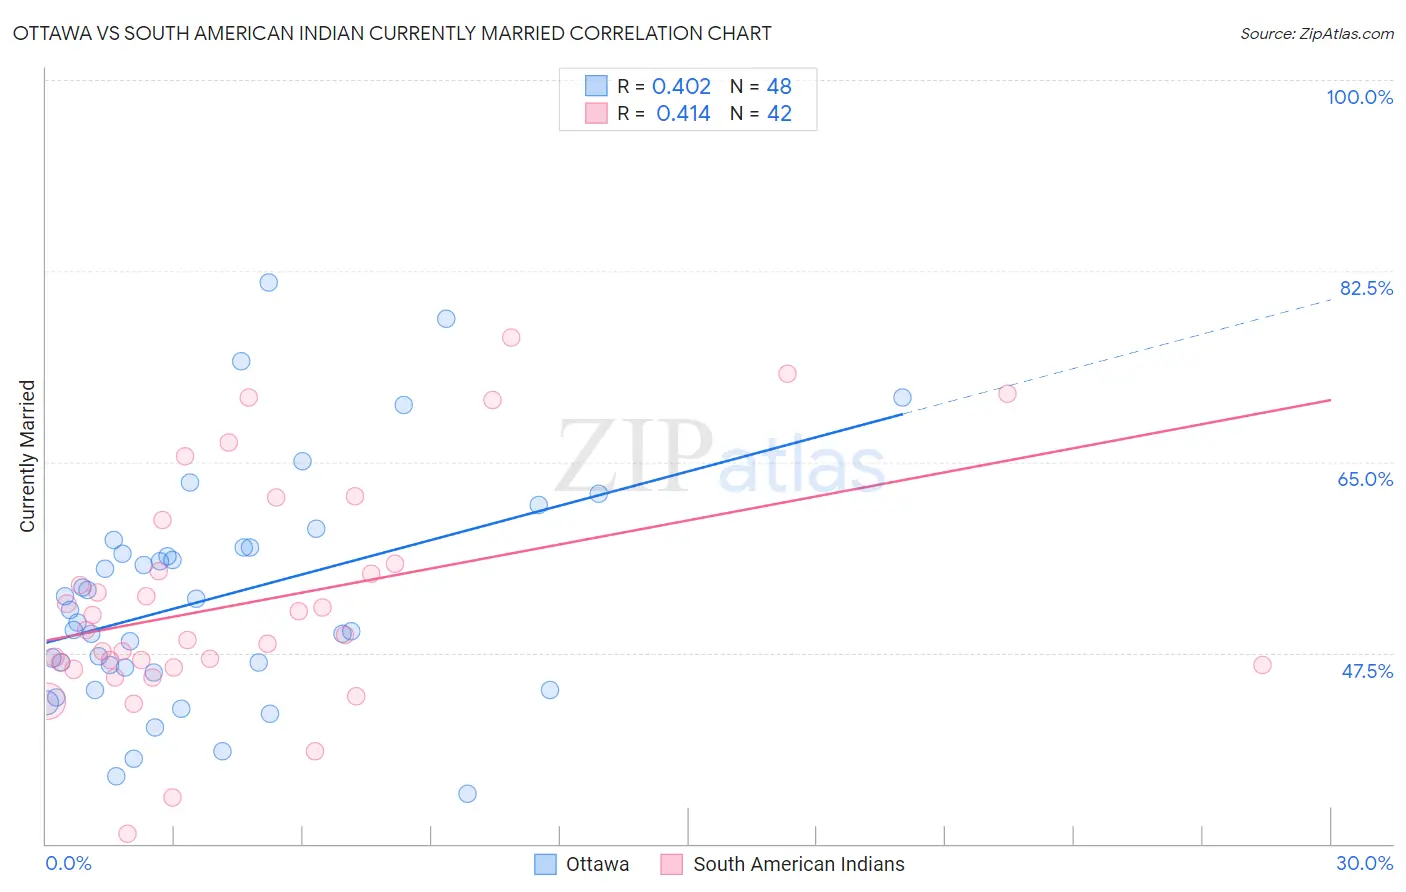
Ottawa vs South American Indian Currently Married Correlation Chart
The statistical analysis conducted on geographies consisting of 49,956,726 people shows a moderate positive correlation between the proportion of Ottawa and percentage of population currently married in the United States with a correlation coefficient (R) of 0.402 and weighted average of 46.5%. Similarly, the statistical analysis conducted on geographies consisting of 164,571,412 people shows a moderate positive correlation between the proportion of South American Indians and percentage of population currently married in the United States with a correlation coefficient (R) of 0.414 and weighted average of 45.8%, a difference of 1.6%.
Currently Married Correlation Summary
| Measurement | Ottawa | South American Indian |
| Minimum | 34.6% | 31.0% |
| Maximum | 81.4% | 76.4% |
| Range | 46.8% | 45.4% |
| Mean | 52.6% | 52.3% |
| Median | 50.9% | 49.3% |
| Interquartile 25% (IQ1) | 45.9% | 46.4% |
| Interquartile 75% (IQ3) | 57.2% | 55.7% |
| Interquartile Range (IQR) | 11.2% | 9.3% |
| Standard Deviation (Sample) | 10.5% | 10.3% |
| Standard Deviation (Population) | 10.4% | 10.2% |
Similar Demographics by Currently Married
Demographics Similar to Ottawa by Currently Married
In terms of currently married, the demographic groups most similar to Ottawa are Costa Rican (46.5%, a difference of 0.020%), Potawatomi (46.5%, a difference of 0.040%), Immigrants from Oceania (46.5%, a difference of 0.060%), Immigrants from Northern Africa (46.5%, a difference of 0.13%), and Brazilian (46.4%, a difference of 0.14%).
| Demographics | Rating | Rank | Currently Married |
| Peruvians | 50.0 /100 | #174 | Average 46.6% |
| Immigrants | Brazil | 49.9 /100 | #175 | Average 46.6% |
| Hawaiians | 48.6 /100 | #176 | Average 46.6% |
| Israelis | 48.6 /100 | #177 | Average 46.6% |
| Chickasaw | 47.8 /100 | #178 | Average 46.6% |
| Immigrants | Oceania | 44.6 /100 | #179 | Average 46.5% |
| Costa Ricans | 43.7 /100 | #180 | Average 46.5% |
| Ottawa | 43.0 /100 | #181 | Average 46.5% |
| Potawatomi | 41.9 /100 | #182 | Average 46.5% |
| Immigrants | Northern Africa | 39.7 /100 | #183 | Fair 46.5% |
| Brazilians | 39.3 /100 | #184 | Fair 46.4% |
| Mongolians | 37.6 /100 | #185 | Fair 46.4% |
| Immigrants | Chile | 36.8 /100 | #186 | Fair 46.4% |
| Immigrants | Peru | 35.3 /100 | #187 | Fair 46.4% |
| Colombians | 31.8 /100 | #188 | Fair 46.3% |
Demographics Similar to South American Indians by Currently Married
In terms of currently married, the demographic groups most similar to South American Indians are Taiwanese (45.8%, a difference of 0.020%), Immigrants from Spain (45.8%, a difference of 0.020%), Immigrants (45.8%, a difference of 0.020%), Immigrants from South America (45.7%, a difference of 0.060%), and Alsatian (45.7%, a difference of 0.070%).
| Demographics | Rating | Rank | Currently Married |
| Immigrants | Colombia | 21.0 /100 | #198 | Fair 46.1% |
| Immigrants | Costa Rica | 19.6 /100 | #199 | Poor 46.0% |
| Creek | 17.2 /100 | #200 | Poor 46.0% |
| Malaysians | 15.3 /100 | #201 | Poor 45.9% |
| Immigrants | Albania | 14.5 /100 | #202 | Poor 45.9% |
| Taiwanese | 11.7 /100 | #203 | Poor 45.8% |
| Immigrants | Spain | 11.6 /100 | #204 | Poor 45.8% |
| South American Indians | 11.5 /100 | #205 | Poor 45.8% |
| Immigrants | Immigrants | 11.2 /100 | #206 | Poor 45.8% |
| Immigrants | South America | 10.8 /100 | #207 | Poor 45.7% |
| Alsatians | 10.8 /100 | #208 | Poor 45.7% |
| Immigrants | Micronesia | 8.8 /100 | #209 | Tragic 45.6% |
| Uruguayans | 7.9 /100 | #210 | Tragic 45.6% |
| Houma | 7.2 /100 | #211 | Tragic 45.5% |
| Marshallese | 7.2 /100 | #212 | Tragic 45.5% |