Ottawa vs Immigrants from the Azores Married-couple Households

COMPARE

Ottawa
Race
Ancestry
AfghanAfricanAlaska NativeAlaskan AthabascanAlbanianAleutAlsatianAmericanApacheArabArapahoArgentineanArmenianAssyrian/Chaldean/SyriacAustralianAustrianBahamianBangladeshiBarbadianBasqueBelgianBelizeanBermudanBhutaneseBlackfeetBolivianBrazilianBritishBritish West IndianBulgarianBurmeseCajunCambodianCanadianCape VerdeanCarpatho RusynCelticCentral AmericanCentral American IndianCherokeeCheyenneChickasawChileanChineseChippewaChoctawColombianColvilleComancheCosta RicanCreeCreekCroatianCrowCubanCypriotCzechCzechoslovakianDanishDelawareDominicanDutchDutch West IndianEastern EuropeanEcuadorianEgyptianEnglishEstonianEthiopianEuropeanFijianFilipinoFinnishFrenchFrench American IndianFrench CanadianGermanGerman RussianGhanaianGreekGuamanian/ChamorroGuatemalanGuyaneseHaitianHmongHonduranHopiHoumaHungarianIcelanderIndian (Asian)IndonesianInupiatIranianIraqiIrishIroquoisIsraeliItalianJamaicanJapaneseJordanianKenyanKiowaKoreanLaotianLatvianLebaneseLiberianLithuanianLumbeeLuxembourgerMacedonianMalaysianMalteseMarshalleseMenomineeMexicanMexican American IndianMongolianMoroccanNative HawaiianNavajoNepaleseNew ZealanderNicaraguanNigerianNorthern EuropeanNorwegianOkinawanOsageOttawaPaiutePakistaniPalestinianPanamanianParaguayanPennsylvania GermanPeruvianPimaPolishPortuguesePotawatomiPuebloPuerto RicanPuget Sound SalishRomanianRussianSalvadoranSamoanScandinavianScotch-IrishScottishSeminoleSenegaleseSerbianShoshoneSierra LeoneanSiouxSlavicSlovakSloveneSomaliSouth AfricanSouth AmericanSouth American IndianSoviet UnionSpaniardSpanishSpanish AmericanSpanish American IndianSri LankanSubsaharan AfricanSudaneseSwedishSwissSyrianTaiwaneseThaiTlingit-HaidaTohono O'OdhamTonganTrinidadian and TobagonianTsimshianTurkishU.S. Virgin IslanderUgandanUkrainianUruguayanUteVenezuelanVietnameseWelshWest IndianYakamaYaquiYugoslavianYumanYup'ikZimbabwean
Immigration
NonimmigrantsImmigrantsAfghanistanAfricaAlbaniaArgentinaArmeniaAsiaAustraliaAustriaBahamasBangladeshBarbadosBelarusBelgiumBelizeBoliviaBosnia and HerzegovinaBrazilBulgariaBurma/MyanmarCabo VerdeCambodiaCameroonCanadaCaribbeanCentral AmericaChileChinaColombiaCongoCosta RicaCroatiaCubaCzechoslovakiaDenmarkDominicaDominican RepublicEastern AfricaEastern AsiaEastern EuropeEcuadorEgyptEl SalvadorEnglandEritreaEthiopiaEuropeFijiFranceGermanyGhanaGreeceGrenadaGuatemalaGuyanaHaitiHondurasHong KongHungaryIndiaIndonesiaIranIraqIrelandIsraelItalyJamaicaJapanJordanKazakhstanKenyaKoreaKuwaitLaosLatin AmericaLatviaLebanonLiberiaLithuaniaMalaysiaMexicoMicronesiaMiddle AfricaMoldovaMoroccoNepalNetherlandsNicaraguaNigeriaNorth AmericaNorth MacedoniaNorthern AfricaNorthern EuropeNorwayOceaniaPakistanPanamaPeruPhilippinesPolandPortugalRomaniaRussiaSaudi ArabiaScotlandSenegalSerbiaSierra LeoneSingaporeSomaliaSouth AfricaSouth AmericaSouth Central AsiaSouth Eastern AsiaSouthern EuropeSpainSri LankaSt. Vincent and the GrenadinesSudanSwedenSwitzerlandSyriaTaiwanThailandTrinidad and TobagoTurkeyUgandaUkraineUruguayUzbekistanVenezuelaVietnamWest IndiesWestern AfricaWestern AsiaWestern EuropeYemenZaireZimbabwe
Immigrants from the Azores
Race
Ancestry
AfghanAfricanAlaska NativeAlaskan AthabascanAlbanianAleutAlsatianAmericanApacheArabArapahoArgentineanArmenianAssyrian/Chaldean/SyriacAustralianAustrianBahamianBangladeshiBarbadianBasqueBelgianBelizeanBermudanBhutaneseBlackfeetBolivianBrazilianBritishBritish West IndianBulgarianBurmeseCajunCambodianCanadianCape VerdeanCarpatho RusynCelticCentral AmericanCentral American IndianCherokeeCheyenneChickasawChileanChineseChippewaChoctawColombianColvilleComancheCosta RicanCreeCreekCroatianCrowCubanCypriotCzechCzechoslovakianDanishDelawareDominicanDutchDutch West IndianEastern EuropeanEcuadorianEgyptianEnglishEstonianEthiopianEuropeanFijianFilipinoFinnishFrenchFrench American IndianFrench CanadianGermanGerman RussianGhanaianGreekGuamanian/ChamorroGuatemalanGuyaneseHaitianHmongHonduranHopiHoumaHungarianIcelanderIndian (Asian)IndonesianInupiatIranianIraqiIrishIroquoisIsraeliItalianJamaicanJapaneseJordanianKenyanKiowaKoreanLaotianLatvianLebaneseLiberianLithuanianLumbeeLuxembourgerMacedonianMalaysianMalteseMarshalleseMenomineeMexicanMexican American IndianMongolianMoroccanNative HawaiianNavajoNepaleseNew ZealanderNicaraguanNigerianNorthern EuropeanNorwegianOkinawanOsagePaiutePakistaniPalestinianPanamanianParaguayanPennsylvania GermanPeruvianPimaPolishPortuguesePotawatomiPuebloPuerto RicanPuget Sound SalishRomanianRussianSalvadoranSamoanScandinavianScotch-IrishScottishSeminoleSenegaleseSerbianShoshoneSierra LeoneanSiouxSlavicSlovakSloveneSomaliSouth AfricanSouth AmericanSouth American IndianSoviet UnionSpaniardSpanishSpanish AmericanSpanish American IndianSri LankanSubsaharan AfricanSudaneseSwedishSwissSyrianTaiwaneseThaiTlingit-HaidaTohono O'OdhamTonganTrinidadian and TobagonianTsimshianTurkishU.S. Virgin IslanderUgandanUkrainianUruguayanUteVenezuelanVietnameseWelshWest IndianYakamaYaquiYugoslavianYumanYup'ikZimbabwean
Immigration
NonimmigrantsImmigrantsAfghanistanAfricaAlbaniaArgentinaArmeniaAsiaAustraliaAustriaBahamasBangladeshBarbadosBelarusBelgiumBelizeBoliviaBosnia and HerzegovinaBrazilBulgariaBurma/MyanmarCabo VerdeCambodiaCameroonCanadaCaribbeanCentral AmericaChileChinaColombiaCongoCosta RicaCroatiaCubaCzechoslovakiaDenmarkDominicaDominican RepublicEastern AfricaEastern AsiaEastern EuropeEcuadorEgyptEl SalvadorEnglandEritreaEthiopiaEuropeFijiFranceGermanyGhanaGreeceGrenadaGuatemalaGuyanaHaitiHondurasHong KongHungaryIndiaIndonesiaIranIraqIrelandIsraelItalyJamaicaJapanJordanKazakhstanKenyaKoreaKuwaitLaosLatin AmericaLatviaLebanonLiberiaLithuaniaMalaysiaMexicoMicronesiaMiddle AfricaMoldovaMoroccoNepalNetherlandsNicaraguaNigeriaNorth AmericaNorth MacedoniaNorthern AfricaNorthern EuropeNorwayOceaniaPakistanPanamaPeruPhilippinesPolandPortugalRomaniaRussiaSaudi ArabiaScotlandSenegalSerbiaSierra LeoneSingaporeSomaliaSouth AfricaSouth AmericaSouth Central AsiaSouth Eastern AsiaSouthern EuropeSpainSri LankaSt. Vincent and the GrenadinesSudanSwedenSwitzerlandSyriaTaiwanThailandTrinidad and TobagoTurkeyUgandaUkraineUruguayUzbekistanVenezuelaVietnamWest IndiesWestern AfricaWestern AsiaWestern EuropeYemenZaireZimbabweAzores
Married-couple Households
Income
Poverty
Unemployment
Labor Participation
Family Structure
Vehicle Availability
Education Level
Disability

Married-couple Households Comparison

Ottawa

Immigrants from the Azores

Poor
Tragic
45.8%
MARRIED-COUPLE HOUSEHOLDS
19.4/ 100
METRIC RATING
198th/ 347
METRIC RANK
45.2%
MARRIED-COUPLE HOUSEHOLDS
5.3/ 100
METRIC RATING
218th/ 347
METRIC RANK

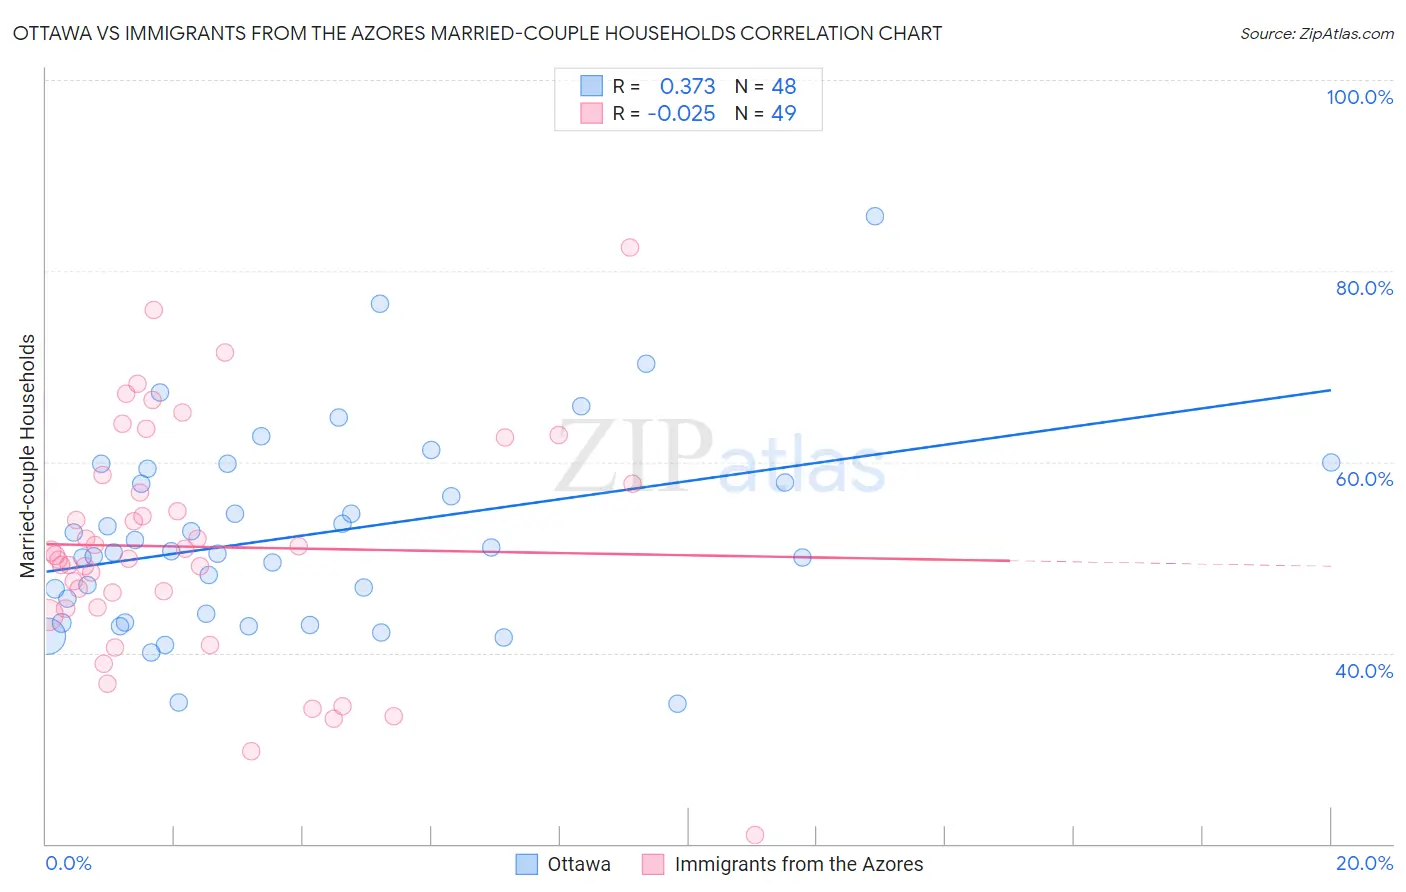
Ottawa vs Immigrants from the Azores Married-couple Households Correlation Chart

The statistical analysis conducted on geographies consisting of 49,944,544 people shows a mild positive correlation between the proportion of Ottawa and percentage of married-couple family households in the United States with a correlation coefficient (R) of 0.373 and weighted average of 45.8%. Similarly, the statistical analysis conducted on geographies consisting of 46,257,310 people shows no correlation between the proportion of Immigrants from the Azores and percentage of married-couple family households in the United States with a correlation coefficient (R) of -0.025 and weighted average of 45.2%, a difference of 1.4%.
Ottawa vs Immigrants from the Azores Married-couple Households

Married-couple Households Correlation Summary

MeasurementOttawaImmigrants from the Azores
Minimum34.7%21.0%
Maximum85.7%82.5%
Range51.0%61.5%
Mean52.3%51.1%
Median50.5%50.2%
Interquartile 25% (IQ1)43.7%44.7%
Interquartile 75% (IQ3)58.6%58.1%
Interquartile Range (IQR)14.9%13.4%
Standard Deviation (Sample)10.3%12.2%
Standard Deviation (Population)10.2%12.1%

Demographics Similar to Ottawa and Immigrants from the Azores by Married-couple Households

In terms of married-couple households, the demographic groups most similar to Ottawa are Carpatho Rusyn (45.7%, a difference of 0.24%), Potawatomi (45.7%, a difference of 0.25%), Immigrants from Serbia (45.7%, a difference of 0.28%), Immigrants from Central America (45.7%, a difference of 0.36%), and Alaska Native (45.6%, a difference of 0.45%). Similarly, the demographic groups most similar to Immigrants from the Azores are Panamanian (45.2%, a difference of 0.030%), Immigrants from Nepal (45.2%, a difference of 0.050%), Immigrants from Portugal (45.2%, a difference of 0.050%), Japanese (45.2%, a difference of 0.070%), and Yakama (45.2%, a difference of 0.090%).
DemographicsRating | RankMarried-couple Households
Ottawa
19.4
/100
|
#198
Poor
45.8%
Carpatho Rusyns
15.7
/100
|
#199
Poor
45.7%
Potawatomi
15.6
/100
|
#200
Poor
45.7%
Immigrants | Serbia
15.2
/100
|
#201
Poor
45.7%
Immigrants | Central America
14.2
/100
|
#202
Poor
45.7%
Alaska Natives
13.0
/100
|
#203
Poor
45.6%
Aleuts
12.5
/100
|
#204
Poor
45.6%
Nepalese
11.9
/100
|
#205
Poor
45.6%
Uruguayans
10.4
/100
|
#206
Poor
45.5%
Immigrants | France
8.8
/100
|
#207
Tragic
45.4%
Hispanics or Latinos
8.7
/100
|
#208
Tragic
45.4%
Immigrants | Uzbekistan
8.4
/100
|
#209
Tragic
45.4%
Cubans
7.7
/100
|
#210
Tragic
45.4%
Immigrants | Spain
7.3
/100
|
#211
Tragic
45.3%
Creek
6.4
/100
|
#212
Tragic
45.3%
Yakama
5.8
/100
|
#213
Tragic
45.2%
Japanese
5.7
/100
|
#214
Tragic
45.2%
Immigrants | Nepal
5.6
/100
|
#215
Tragic
45.2%
Immigrants | Portugal
5.6
/100
|
#216
Tragic
45.2%
Panamanians
5.5
/100
|
#217
Tragic
45.2%
Immigrants | Azores
5.3
/100
|
#218
Tragic
45.2%