Ottawa vs Hopi Married-couple Households

COMPARE

Ottawa
Race
Ancestry
AfghanAfricanAlaska NativeAlaskan AthabascanAlbanianAleutAlsatianAmericanApacheArabArapahoArgentineanArmenianAssyrian/Chaldean/SyriacAustralianAustrianBahamianBangladeshiBarbadianBasqueBelgianBelizeanBermudanBhutaneseBlackfeetBolivianBrazilianBritishBritish West IndianBulgarianBurmeseCajunCambodianCanadianCape VerdeanCarpatho RusynCelticCentral AmericanCentral American IndianCherokeeCheyenneChickasawChileanChineseChippewaChoctawColombianColvilleComancheCosta RicanCreeCreekCroatianCrowCubanCypriotCzechCzechoslovakianDanishDelawareDominicanDutchDutch West IndianEastern EuropeanEcuadorianEgyptianEnglishEstonianEthiopianEuropeanFijianFilipinoFinnishFrenchFrench American IndianFrench CanadianGermanGerman RussianGhanaianGreekGuamanian/ChamorroGuatemalanGuyaneseHaitianHmongHonduranHoumaHungarianIcelanderIndian (Asian)IndonesianInupiatIranianIraqiIrishIroquoisIsraeliItalianJamaicanJapaneseJordanianKenyanKiowaKoreanLaotianLatvianLebaneseLiberianLithuanianLumbeeLuxembourgerMacedonianMalaysianMalteseMarshalleseMenomineeMexicanMexican American IndianMongolianMoroccanNative HawaiianNavajoNepaleseNew ZealanderNicaraguanNigerianNorthern EuropeanNorwegianOkinawanOsageOttawaPaiutePakistaniPalestinianPanamanianParaguayanPennsylvania GermanPeruvianPimaPolishPortuguesePotawatomiPuebloPuerto RicanPuget Sound SalishRomanianRussianSalvadoranSamoanScandinavianScotch-IrishScottishSeminoleSenegaleseSerbianShoshoneSierra LeoneanSiouxSlavicSlovakSloveneSomaliSouth AfricanSouth AmericanSouth American IndianSoviet UnionSpaniardSpanishSpanish AmericanSpanish American IndianSri LankanSubsaharan AfricanSudaneseSwedishSwissSyrianTaiwaneseThaiTlingit-HaidaTohono O'OdhamTonganTrinidadian and TobagonianTsimshianTurkishU.S. Virgin IslanderUgandanUkrainianUruguayanUteVenezuelanVietnameseWelshWest IndianYakamaYaquiYugoslavianYumanYup'ikZimbabwean
Immigration
NonimmigrantsImmigrantsAfghanistanAfricaAlbaniaArgentinaArmeniaAsiaAustraliaAustriaBahamasBangladeshBarbadosBelarusBelgiumBelizeBoliviaBosnia and HerzegovinaBrazilBulgariaBurma/MyanmarCabo VerdeCambodiaCameroonCanadaCaribbeanCentral AmericaChileChinaColombiaCongoCosta RicaCroatiaCubaCzechoslovakiaDenmarkDominicaDominican RepublicEastern AfricaEastern AsiaEastern EuropeEcuadorEgyptEl SalvadorEnglandEritreaEthiopiaEuropeFijiFranceGermanyGhanaGreeceGrenadaGuatemalaGuyanaHaitiHondurasHong KongHungaryIndiaIndonesiaIranIraqIrelandIsraelItalyJamaicaJapanJordanKazakhstanKenyaKoreaKuwaitLaosLatin AmericaLatviaLebanonLiberiaLithuaniaMalaysiaMexicoMicronesiaMiddle AfricaMoldovaMoroccoNepalNetherlandsNicaraguaNigeriaNorth AmericaNorth MacedoniaNorthern AfricaNorthern EuropeNorwayOceaniaPakistanPanamaPeruPhilippinesPolandPortugalRomaniaRussiaSaudi ArabiaScotlandSenegalSerbiaSierra LeoneSingaporeSomaliaSouth AfricaSouth AmericaSouth Central AsiaSouth Eastern AsiaSouthern EuropeSpainSri LankaSt. Vincent and the GrenadinesSudanSwedenSwitzerlandSyriaTaiwanThailandTrinidad and TobagoTurkeyUgandaUkraineUruguayUzbekistanVenezuelaVietnamWest IndiesWestern AfricaWestern AsiaWestern EuropeYemenZaireZimbabweAzores
Hopi
Race
Ancestry
AfghanAfricanAlaska NativeAlaskan AthabascanAlbanianAleutAlsatianAmericanApacheArabArapahoArgentineanArmenianAssyrian/Chaldean/SyriacAustralianAustrianBahamianBangladeshiBarbadianBasqueBelgianBelizeanBermudanBhutaneseBlackfeetBolivianBrazilianBritishBritish West IndianBulgarianBurmeseCajunCambodianCanadianCape VerdeanCarpatho RusynCelticCentral AmericanCentral American IndianCherokeeCheyenneChickasawChileanChineseChippewaChoctawColombianColvilleComancheCosta RicanCreeCreekCroatianCrowCubanCypriotCzechCzechoslovakianDanishDelawareDominicanDutchDutch West IndianEastern EuropeanEcuadorianEgyptianEnglishEstonianEthiopianEuropeanFijianFilipinoFinnishFrenchFrench American IndianFrench CanadianGermanGerman RussianGhanaianGreekGuamanian/ChamorroGuatemalanGuyaneseHaitianHmongHonduranHopiHoumaHungarianIcelanderIndian (Asian)IndonesianInupiatIranianIraqiIrishIroquoisIsraeliItalianJamaicanJapaneseJordanianKenyanKiowaKoreanLaotianLatvianLebaneseLiberianLithuanianLumbeeLuxembourgerMacedonianMalaysianMalteseMarshalleseMenomineeMexicanMexican American IndianMongolianMoroccanNative HawaiianNavajoNepaleseNew ZealanderNicaraguanNigerianNorthern EuropeanNorwegianOkinawanOsagePaiutePakistaniPalestinianPanamanianParaguayanPennsylvania GermanPeruvianPimaPolishPortuguesePotawatomiPuebloPuerto RicanPuget Sound SalishRomanianRussianSalvadoranSamoanScandinavianScotch-IrishScottishSeminoleSenegaleseSerbianShoshoneSierra LeoneanSiouxSlavicSlovakSloveneSomaliSouth AfricanSouth AmericanSouth American IndianSoviet UnionSpaniardSpanishSpanish AmericanSpanish American IndianSri LankanSubsaharan AfricanSudaneseSwedishSwissSyrianTaiwaneseThaiTlingit-HaidaTohono O'OdhamTonganTrinidadian and TobagonianTsimshianTurkishU.S. Virgin IslanderUgandanUkrainianUruguayanUteVenezuelanVietnameseWelshWest IndianYakamaYaquiYugoslavianYumanYup'ikZimbabwean
Immigration
NonimmigrantsImmigrantsAfghanistanAfricaAlbaniaArgentinaArmeniaAsiaAustraliaAustriaBahamasBangladeshBarbadosBelarusBelgiumBelizeBoliviaBosnia and HerzegovinaBrazilBulgariaBurma/MyanmarCabo VerdeCambodiaCameroonCanadaCaribbeanCentral AmericaChileChinaColombiaCongoCosta RicaCroatiaCubaCzechoslovakiaDenmarkDominicaDominican RepublicEastern AfricaEastern AsiaEastern EuropeEcuadorEgyptEl SalvadorEnglandEritreaEthiopiaEuropeFijiFranceGermanyGhanaGreeceGrenadaGuatemalaGuyanaHaitiHondurasHong KongHungaryIndiaIndonesiaIranIraqIrelandIsraelItalyJamaicaJapanJordanKazakhstanKenyaKoreaKuwaitLaosLatin AmericaLatviaLebanonLiberiaLithuaniaMalaysiaMexicoMicronesiaMiddle AfricaMoldovaMoroccoNepalNetherlandsNicaraguaNigeriaNorth AmericaNorth MacedoniaNorthern AfricaNorthern EuropeNorwayOceaniaPakistanPanamaPeruPhilippinesPolandPortugalRomaniaRussiaSaudi ArabiaScotlandSenegalSerbiaSierra LeoneSingaporeSomaliaSouth AfricaSouth AmericaSouth Central AsiaSouth Eastern AsiaSouthern EuropeSpainSri LankaSt. Vincent and the GrenadinesSudanSwedenSwitzerlandSyriaTaiwanThailandTrinidad and TobagoTurkeyUgandaUkraineUruguayUzbekistanVenezuelaVietnamWest IndiesWestern AfricaWestern AsiaWestern EuropeYemenZaireZimbabweAzores
Married-couple Households
Income
Poverty
Unemployment
Labor Participation
Family Structure
Vehicle Availability
Education Level
Disability

Married-couple Households Comparison

Ottawa

Hopi

Poor
Tragic
45.8%
MARRIED-COUPLE HOUSEHOLDS
19.4/ 100
METRIC RATING
198th/ 347
METRIC RANK
36.7%
MARRIED-COUPLE HOUSEHOLDS
0.0/ 100
METRIC RATING
345th/ 347
METRIC RANK

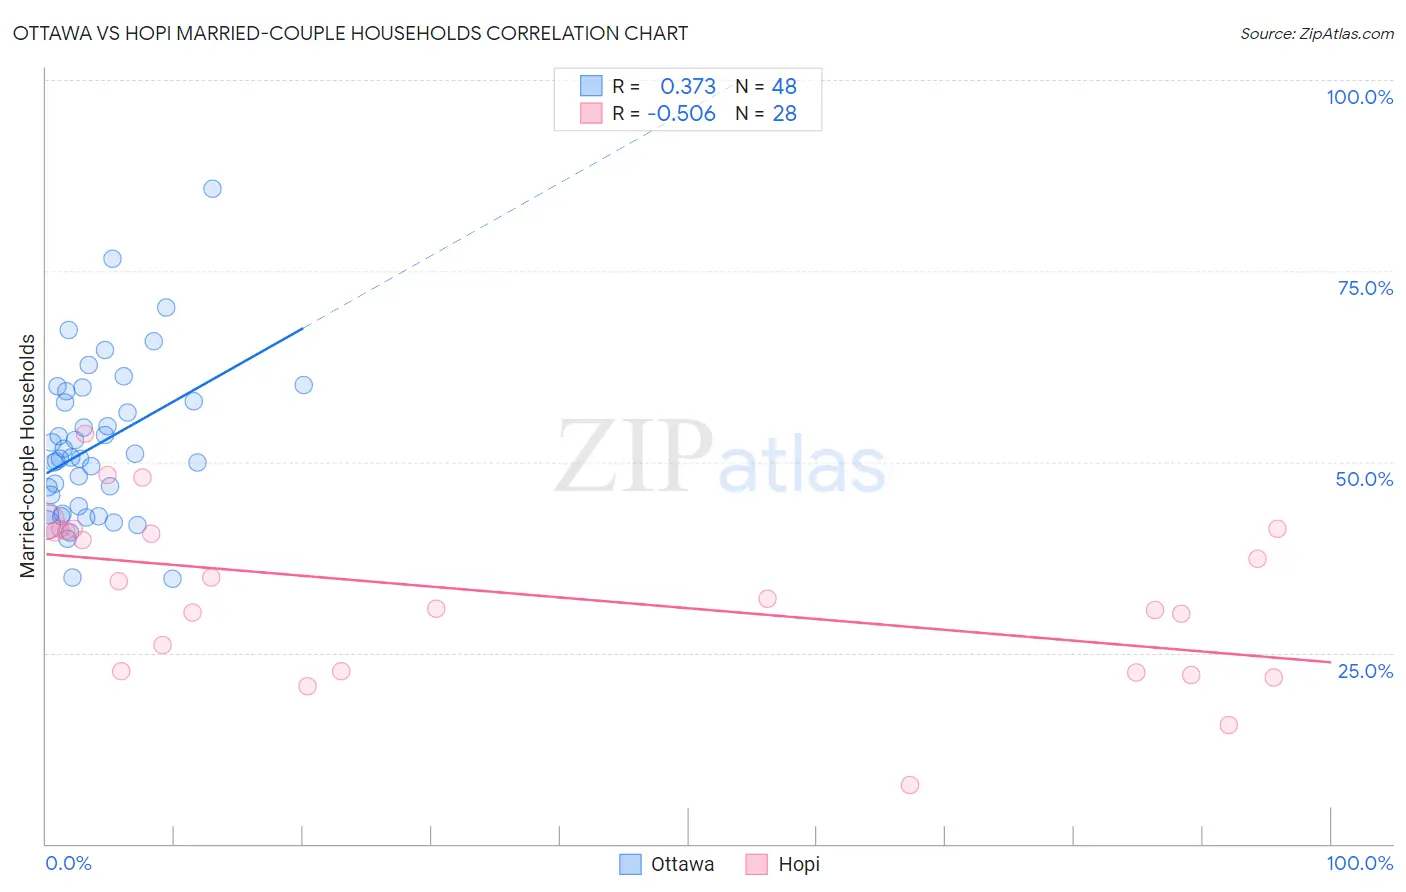
Ottawa vs Hopi Married-couple Households Correlation Chart

The statistical analysis conducted on geographies consisting of 49,944,544 people shows a mild positive correlation between the proportion of Ottawa and percentage of married-couple family households in the United States with a correlation coefficient (R) of 0.373 and weighted average of 45.8%. Similarly, the statistical analysis conducted on geographies consisting of 74,731,609 people shows a substantial negative correlation between the proportion of Hopi and percentage of married-couple family households in the United States with a correlation coefficient (R) of -0.506 and weighted average of 36.7%, a difference of 24.9%.
Ottawa vs Hopi Married-couple Households

Married-couple Households Correlation Summary

MeasurementOttawaHopi
Minimum34.7%7.8%
Maximum85.7%53.7%
Range51.0%45.9%
Mean52.3%32.9%
Median50.5%33.2%
Interquartile 25% (IQ1)43.7%22.6%
Interquartile 75% (IQ3)58.6%41.0%
Interquartile Range (IQR)14.9%18.4%
Standard Deviation (Sample)10.3%10.8%
Standard Deviation (Population)10.2%10.6%

Similar Demographics by Married-couple Households

Demographics Similar to Ottawa by Married-couple Households

In terms of married-couple households, the demographic groups most similar to Ottawa are Cambodian (45.9%, a difference of 0.11%), Immigrants from South America (45.9%, a difference of 0.16%), Chickasaw (45.9%, a difference of 0.19%), Mexican American Indian (45.9%, a difference of 0.22%), and Taiwanese (45.9%, a difference of 0.23%).
DemographicsRating | RankMarried-couple Households
Choctaw
24.9
/100
|
#191
Fair
46.0%
Immigrants | Northern Africa
24.6
/100
|
#192
Fair
46.0%
Taiwanese
23.4
/100
|
#193
Fair
45.9%
Mexican American Indians
23.3
/100
|
#194
Fair
45.9%
Chickasaw
22.7
/100
|
#195
Fair
45.9%
Immigrants | South America
22.2
/100
|
#196
Fair
45.9%
Cambodians
21.3
/100
|
#197
Fair
45.9%
Ottawa
19.4
/100
|
#198
Poor
45.8%
Carpatho Rusyns
15.7
/100
|
#199
Poor
45.7%
Potawatomi
15.6
/100
|
#200
Poor
45.7%
Immigrants | Serbia
15.2
/100
|
#201
Poor
45.7%
Immigrants | Central America
14.2
/100
|
#202
Poor
45.7%
Alaska Natives
13.0
/100
|
#203
Poor
45.6%
Aleuts
12.5
/100
|
#204
Poor
45.6%
Nepalese
11.9
/100
|
#205
Poor
45.6%

Demographics Similar to Hopi by Married-couple Households

In terms of married-couple households, the demographic groups most similar to Hopi are Immigrants from Cabo Verde (36.2%, a difference of 1.2%), Immigrants from Dominican Republic (37.3%, a difference of 1.8%), Immigrants from Grenada (37.5%, a difference of 2.2%), Pima (35.6%, a difference of 3.2%), and Tohono O'odham (37.9%, a difference of 3.3%).
DemographicsRating | RankMarried-couple Households
Immigrants | West Indies
0.0
/100
|
#333
Tragic
39.0%
Immigrants | St. Vincent and the Grenadines
0.0
/100
|
#334
Tragic
38.7%
Senegalese
0.0
/100
|
#335
Tragic
38.6%
Blacks/African Americans
0.0
/100
|
#336
Tragic
38.5%
Immigrants | Somalia
0.0
/100
|
#337
Tragic
38.4%
Immigrants | Senegal
0.0
/100
|
#338
Tragic
38.4%
British West Indians
0.0
/100
|
#339
Tragic
38.3%
Dominicans
0.0
/100
|
#340
Tragic
38.2%
Cape Verdeans
0.0
/100
|
#341
Tragic
38.1%
Tohono O'odham
0.0
/100
|
#342
Tragic
37.9%
Immigrants | Grenada
0.0
/100
|
#343
Tragic
37.5%
Immigrants | Dominican Republic
0.0
/100
|
#344
Tragic
37.3%
Hopi
0.0
/100
|
#345
Tragic
36.7%
Immigrants | Cabo Verde
0.0
/100
|
#346
Tragic
36.2%
Pima
0.0
/100
|
#347
Tragic
35.6%