Immigrants from Italy vs Immigrants from the Azores Married-couple Households
COMPARE
Immigrants from Italy
Immigrants from the Azores
Married-couple Households
Married-couple Households Comparison
Immigrants from Italy
Immigrants from the Azores
47.9%
MARRIED-COUPLE HOUSEHOLDS
96.3/ 100
METRIC RATING
100th/ 347
METRIC RANK
45.2%
MARRIED-COUPLE HOUSEHOLDS
5.3/ 100
METRIC RATING
218th/ 347
METRIC RANK
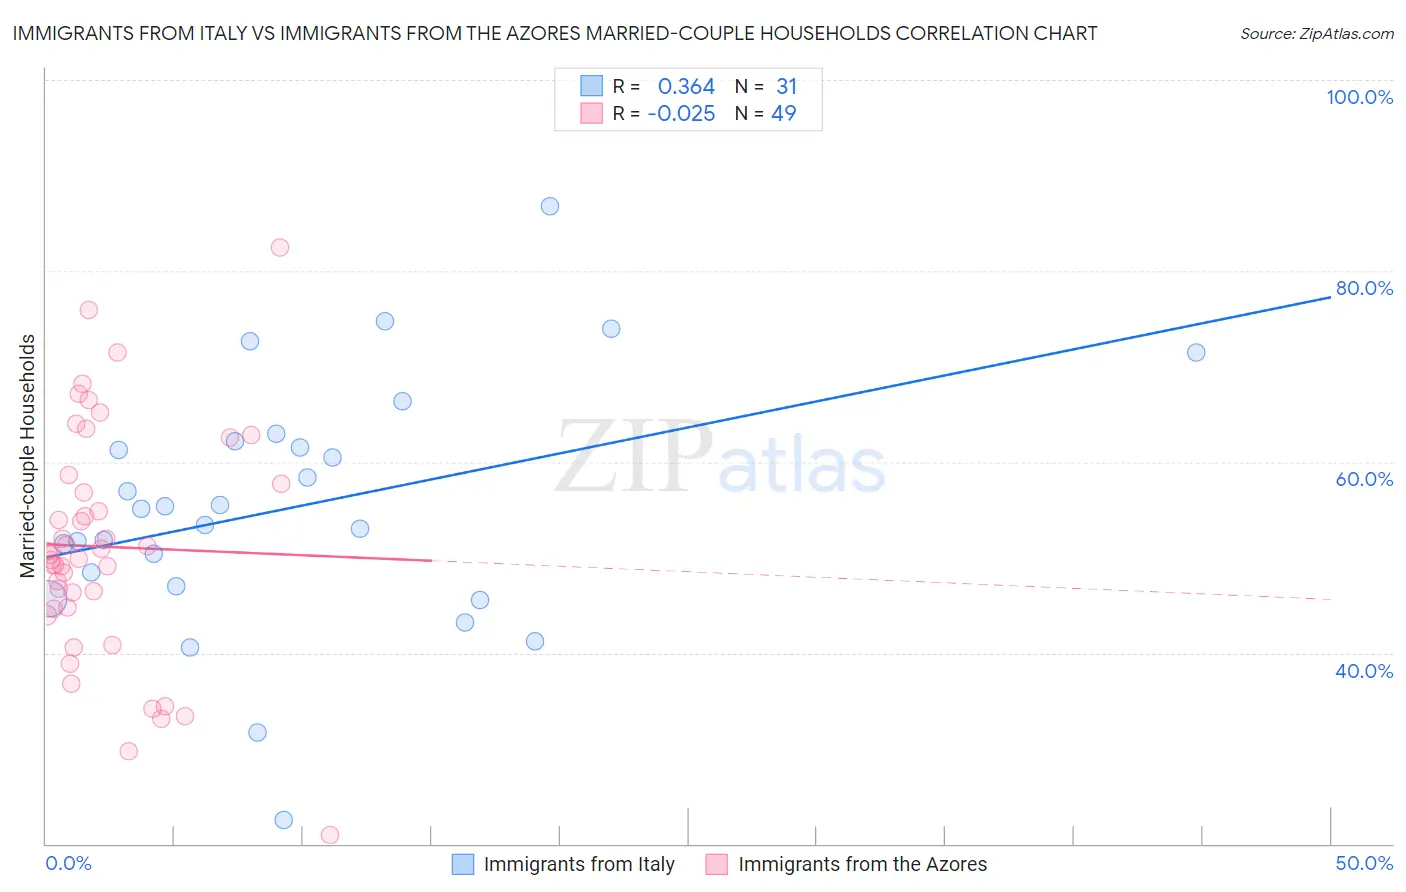
Immigrants from Italy vs Immigrants from the Azores Married-couple Households Correlation Chart
The statistical analysis conducted on geographies consisting of 324,146,965 people shows a mild positive correlation between the proportion of Immigrants from Italy and percentage of married-couple family households in the United States with a correlation coefficient (R) of 0.364 and weighted average of 47.9%. Similarly, the statistical analysis conducted on geographies consisting of 46,257,310 people shows no correlation between the proportion of Immigrants from the Azores and percentage of married-couple family households in the United States with a correlation coefficient (R) of -0.025 and weighted average of 45.2%, a difference of 5.9%.
Married-couple Households Correlation Summary
| Measurement | Immigrants from Italy | Immigrants from the Azores |
| Minimum | 22.5% | 21.0% |
| Maximum | 86.8% | 82.5% |
| Range | 64.2% | 61.5% |
| Mean | 55.3% | 51.1% |
| Median | 55.1% | 50.2% |
| Interquartile 25% (IQ1) | 47.0% | 44.7% |
| Interquartile 75% (IQ3) | 62.1% | 58.1% |
| Interquartile Range (IQR) | 15.1% | 13.4% |
| Standard Deviation (Sample) | 13.2% | 12.2% |
| Standard Deviation (Population) | 12.9% | 12.1% |
Similar Demographics by Married-couple Households
Demographics Similar to Immigrants from Italy by Married-couple Households
In terms of married-couple households, the demographic groups most similar to Immigrants from Italy are Immigrants from Austria (47.9%, a difference of 0.010%), Immigrants from North Macedonia (47.9%, a difference of 0.020%), Latvian (47.9%, a difference of 0.030%), Immigrants from Egypt (47.9%, a difference of 0.060%), and Turkish (47.8%, a difference of 0.060%).
| Demographics | Rating | Rank | Married-couple Households |
| Lebanese | 96.9 /100 | #93 | Exceptional 47.9% |
| Americans | 96.9 /100 | #94 | Exceptional 47.9% |
| Immigrants | Belgium | 96.8 /100 | #95 | Exceptional 47.9% |
| Immigrants | Egypt | 96.6 /100 | #96 | Exceptional 47.9% |
| Latvians | 96.5 /100 | #97 | Exceptional 47.9% |
| Immigrants | North Macedonia | 96.4 /100 | #98 | Exceptional 47.9% |
| Immigrants | Austria | 96.4 /100 | #99 | Exceptional 47.9% |
| Immigrants | Italy | 96.3 /100 | #100 | Exceptional 47.9% |
| Turks | 96.1 /100 | #101 | Exceptional 47.8% |
| Slavs | 96.0 /100 | #102 | Exceptional 47.8% |
| Hawaiians | 96.0 /100 | #103 | Exceptional 47.8% |
| Immigrants | South Africa | 96.0 /100 | #104 | Exceptional 47.8% |
| Immigrants | Czechoslovakia | 95.5 /100 | #105 | Exceptional 47.8% |
| Portuguese | 95.5 /100 | #106 | Exceptional 47.8% |
| Estonians | 94.7 /100 | #107 | Exceptional 47.7% |
Demographics Similar to Immigrants from the Azores by Married-couple Households
In terms of married-couple households, the demographic groups most similar to Immigrants from the Azores are Nicaraguan (45.2%, a difference of 0.010%), Panamanian (45.2%, a difference of 0.030%), Immigrants from Thailand (45.2%, a difference of 0.040%), Immigrants from Nepal (45.2%, a difference of 0.050%), and Immigrants from Portugal (45.2%, a difference of 0.050%).
| Demographics | Rating | Rank | Married-couple Households |
| Immigrants | Spain | 7.3 /100 | #211 | Tragic 45.3% |
| Creek | 6.4 /100 | #212 | Tragic 45.3% |
| Yakama | 5.8 /100 | #213 | Tragic 45.2% |
| Japanese | 5.7 /100 | #214 | Tragic 45.2% |
| Immigrants | Nepal | 5.6 /100 | #215 | Tragic 45.2% |
| Immigrants | Portugal | 5.6 /100 | #216 | Tragic 45.2% |
| Panamanians | 5.5 /100 | #217 | Tragic 45.2% |
| Immigrants | Azores | 5.3 /100 | #218 | Tragic 45.2% |
| Nicaraguans | 5.3 /100 | #219 | Tragic 45.2% |
| Immigrants | Thailand | 5.1 /100 | #220 | Tragic 45.2% |
| Tlingit-Haida | 4.9 /100 | #221 | Tragic 45.1% |
| Immigrants | Laos | 4.6 /100 | #222 | Tragic 45.1% |
| Immigrants | Cambodia | 2.7 /100 | #223 | Tragic 44.9% |
| Immigrants | Micronesia | 2.6 /100 | #224 | Tragic 44.9% |
| Dutch West Indians | 2.6 /100 | #225 | Tragic 44.9% |