Osage vs Aleut Family Households
COMPARE
Osage
Aleut
Family Households
Family Households Comparison
Osage
Aleuts
63.7%
FAMILY HOUSEHOLDS
7.0/ 100
METRIC RATING
217th/ 347
METRIC RANK
63.4%
FAMILY HOUSEHOLDS
1.9/ 100
METRIC RATING
239th/ 347
METRIC RANK
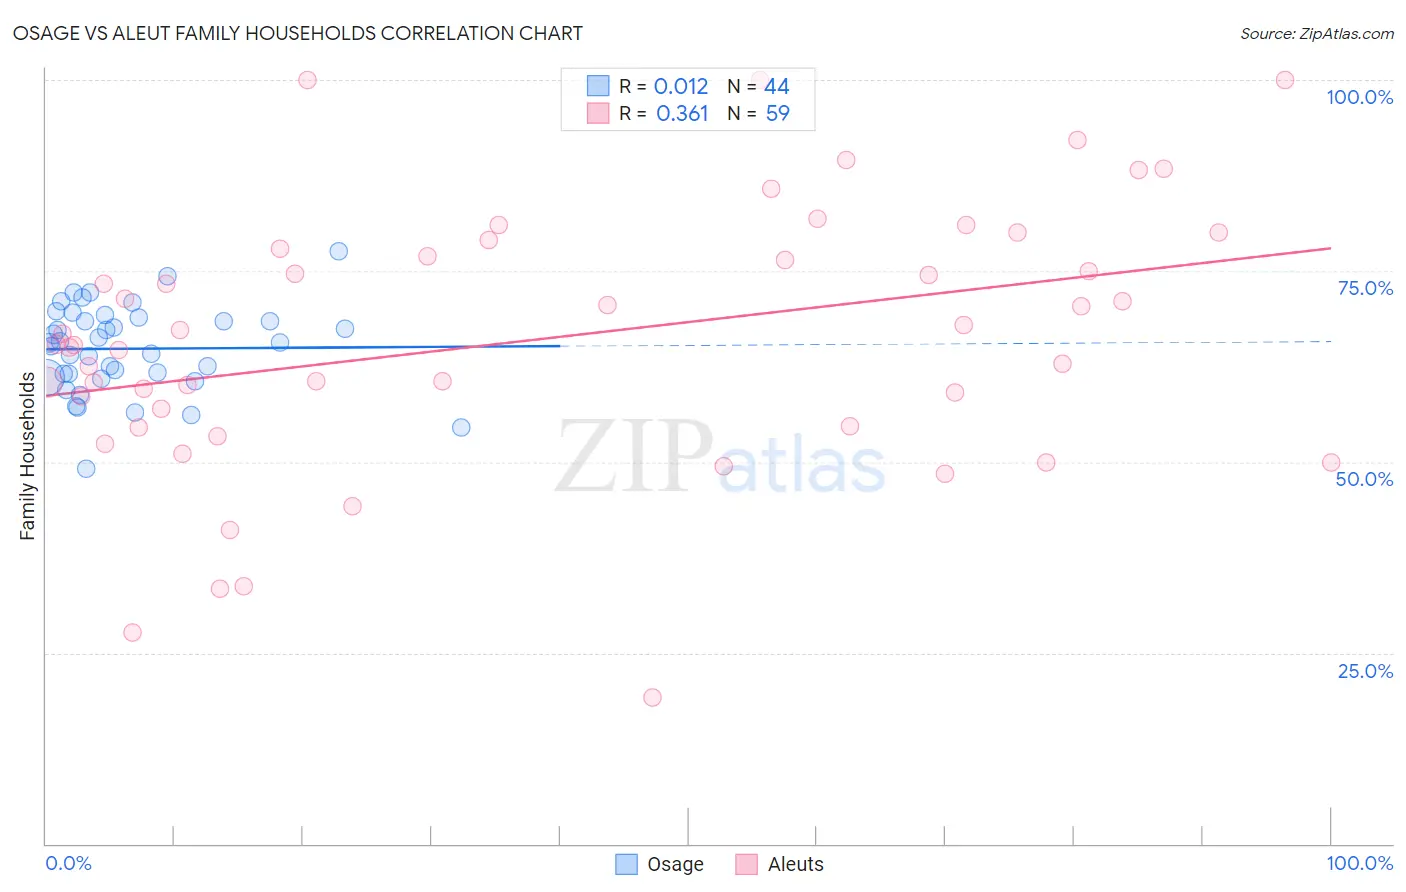
Osage vs Aleut Family Households Correlation Chart
The statistical analysis conducted on geographies consisting of 91,796,062 people shows no correlation between the proportion of Osage and percentage of family households in the United States with a correlation coefficient (R) of 0.012 and weighted average of 63.7%. Similarly, the statistical analysis conducted on geographies consisting of 61,774,066 people shows a mild positive correlation between the proportion of Aleuts and percentage of family households in the United States with a correlation coefficient (R) of 0.361 and weighted average of 63.4%, a difference of 0.46%.
Family Households Correlation Summary
| Measurement | Osage | Aleut |
| Minimum | 49.2% | 19.2% |
| Maximum | 77.6% | 100.0% |
| Range | 28.5% | 80.8% |
| Mean | 64.8% | 66.1% |
| Median | 65.7% | 65.4% |
| Interquartile 25% (IQ1) | 61.3% | 54.7% |
| Interquartile 75% (IQ3) | 68.7% | 77.9% |
| Interquartile Range (IQR) | 7.4% | 23.2% |
| Standard Deviation (Sample) | 5.7% | 17.3% |
| Standard Deviation (Population) | 5.7% | 17.2% |
Similar Demographics by Family Households
Demographics Similar to Osage by Family Households
In terms of family households, the demographic groups most similar to Osage are Marshallese (63.7%, a difference of 0.0%), Croatian (63.8%, a difference of 0.010%), Belgian (63.8%, a difference of 0.030%), Macedonian (63.7%, a difference of 0.030%), and Immigrants from Europe (63.7%, a difference of 0.030%).
| Demographics | Rating | Rank | Family Households |
| Immigrants | Thailand | 9.6 /100 | #210 | Tragic 63.8% |
| Shoshone | 9.4 /100 | #211 | Tragic 63.8% |
| Immigrants | Netherlands | 9.4 /100 | #212 | Tragic 63.8% |
| Immigrants | Northern Europe | 8.8 /100 | #213 | Tragic 63.8% |
| Celtics | 8.0 /100 | #214 | Tragic 63.8% |
| Belgians | 7.6 /100 | #215 | Tragic 63.8% |
| Croatians | 7.3 /100 | #216 | Tragic 63.8% |
| Osage | 7.0 /100 | #217 | Tragic 63.7% |
| Marshallese | 6.9 /100 | #218 | Tragic 63.7% |
| Macedonians | 6.5 /100 | #219 | Tragic 63.7% |
| Immigrants | Europe | 6.4 /100 | #220 | Tragic 63.7% |
| Immigrants | South Africa | 5.9 /100 | #221 | Tragic 63.7% |
| Immigrants | Belarus | 5.5 /100 | #222 | Tragic 63.7% |
| French Canadians | 5.4 /100 | #223 | Tragic 63.7% |
| Turks | 4.5 /100 | #224 | Tragic 63.6% |
Demographics Similar to Aleuts by Family Households
In terms of family households, the demographic groups most similar to Aleuts are South African (63.4%, a difference of 0.0%), Immigrants from St. Vincent and the Grenadines (63.4%, a difference of 0.010%), Immigrants from Israel (63.4%, a difference of 0.010%), Comanche (63.5%, a difference of 0.030%), and Immigrants from Zimbabwe (63.5%, a difference of 0.030%).
| Demographics | Rating | Rank | Family Households |
| Immigrants | Northern Africa | 2.6 /100 | #232 | Tragic 63.5% |
| Immigrants | Armenia | 2.6 /100 | #233 | Tragic 63.5% |
| Finns | 2.3 /100 | #234 | Tragic 63.5% |
| Albanians | 2.2 /100 | #235 | Tragic 63.5% |
| Ghanaians | 2.1 /100 | #236 | Tragic 63.5% |
| Comanche | 2.1 /100 | #237 | Tragic 63.5% |
| Immigrants | Zimbabwe | 2.0 /100 | #238 | Tragic 63.5% |
| Aleuts | 1.9 /100 | #239 | Tragic 63.4% |
| South Africans | 1.9 /100 | #240 | Tragic 63.4% |
| Immigrants | St. Vincent and the Grenadines | 1.9 /100 | #241 | Tragic 63.4% |
| Immigrants | Israel | 1.8 /100 | #242 | Tragic 63.4% |
| Immigrants | Czechoslovakia | 1.8 /100 | #243 | Tragic 63.4% |
| Eastern Europeans | 1.6 /100 | #244 | Tragic 63.4% |
| Immigrants | Dominica | 1.6 /100 | #245 | Tragic 63.4% |
| Immigrants | Ghana | 1.6 /100 | #246 | Tragic 63.4% |