Osage vs Polish Family Households
COMPARE
Osage
Polish
Family Households
Family Households Comparison
Osage
Poles
63.7%
FAMILY HOUSEHOLDS
7.0/ 100
METRIC RATING
217th/ 347
METRIC RANK
64.0%
FAMILY HOUSEHOLDS
18.9/ 100
METRIC RATING
198th/ 347
METRIC RANK
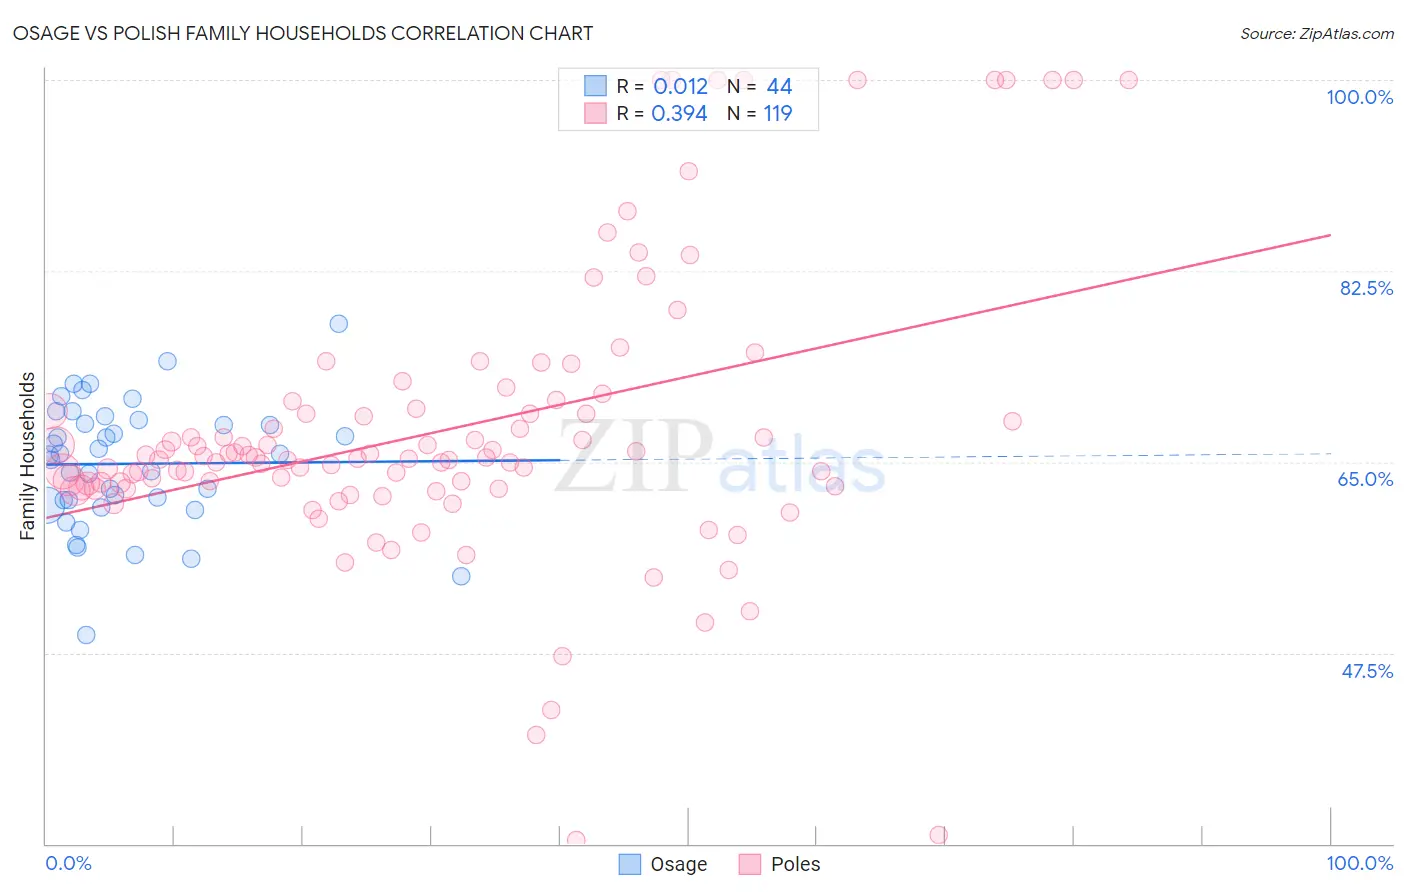
Osage vs Polish Family Households Correlation Chart
The statistical analysis conducted on geographies consisting of 91,796,062 people shows no correlation between the proportion of Osage and percentage of family households in the United States with a correlation coefficient (R) of 0.012 and weighted average of 63.7%. Similarly, the statistical analysis conducted on geographies consisting of 559,976,877 people shows a mild positive correlation between the proportion of Poles and percentage of family households in the United States with a correlation coefficient (R) of 0.394 and weighted average of 64.0%, a difference of 0.38%.
Family Households Correlation Summary
| Measurement | Osage | Polish |
| Minimum | 49.2% | 30.3% |
| Maximum | 77.6% | 100.0% |
| Range | 28.5% | 69.7% |
| Mean | 64.8% | 68.0% |
| Median | 65.7% | 65.4% |
| Interquartile 25% (IQ1) | 61.3% | 62.7% |
| Interquartile 75% (IQ3) | 68.7% | 69.9% |
| Interquartile Range (IQR) | 7.4% | 7.2% |
| Standard Deviation (Sample) | 5.7% | 13.1% |
| Standard Deviation (Population) | 5.7% | 13.1% |
Demographics Similar to Osage and Poles by Family Households
In terms of family households, the demographic groups most similar to Osage are Croatian (63.8%, a difference of 0.010%), Belgian (63.8%, a difference of 0.030%), Celtic (63.8%, a difference of 0.050%), Immigrants from Northern Europe (63.8%, a difference of 0.090%), and Shoshone (63.8%, a difference of 0.11%). Similarly, the demographic groups most similar to Poles are Seminole (64.0%, a difference of 0.0%), Slavic (64.0%, a difference of 0.010%), Immigrants from Malaysia (64.0%, a difference of 0.020%), Immigrants from Eastern Europe (64.0%, a difference of 0.040%), and Iranian (63.9%, a difference of 0.14%).
| Demographics | Rating | Rank | Family Households |
| Seminole | 18.9 /100 | #197 | Poor 64.0% |
| Poles | 18.9 /100 | #198 | Poor 64.0% |
| Slavs | 18.6 /100 | #199 | Poor 64.0% |
| Immigrants | Malaysia | 17.9 /100 | #200 | Poor 64.0% |
| Immigrants | Eastern Europe | 17.2 /100 | #201 | Poor 64.0% |
| Iranians | 13.5 /100 | #202 | Poor 63.9% |
| Norwegians | 13.2 /100 | #203 | Poor 63.9% |
| Immigrants | Uruguay | 12.8 /100 | #204 | Poor 63.9% |
| Brazilians | 12.4 /100 | #205 | Poor 63.9% |
| Immigrants | Lithuania | 12.1 /100 | #206 | Poor 63.9% |
| Nigerians | 11.5 /100 | #207 | Poor 63.9% |
| Immigrants | Bangladesh | 11.4 /100 | #208 | Poor 63.9% |
| Sierra Leoneans | 11.2 /100 | #209 | Poor 63.9% |
| Immigrants | Thailand | 9.6 /100 | #210 | Tragic 63.8% |
| Shoshone | 9.4 /100 | #211 | Tragic 63.8% |
| Immigrants | Netherlands | 9.4 /100 | #212 | Tragic 63.8% |
| Immigrants | Northern Europe | 8.8 /100 | #213 | Tragic 63.8% |
| Celtics | 8.0 /100 | #214 | Tragic 63.8% |
| Belgians | 7.6 /100 | #215 | Tragic 63.8% |
| Croatians | 7.3 /100 | #216 | Tragic 63.8% |
| Osage | 7.0 /100 | #217 | Tragic 63.7% |