Norwegian vs Immigrants from Kenya Single Father Households
COMPARE
Norwegian
Immigrants from Kenya
Single Father Households
Single Father Households Comparison
Norwegians
Immigrants from Kenya
2.4%
SINGLE FATHER HOUSEHOLDS
17.1/ 100
METRIC RATING
213th/ 347
METRIC RANK
2.4%
SINGLE FATHER HOUSEHOLDS
20.3/ 100
METRIC RATING
208th/ 347
METRIC RANK
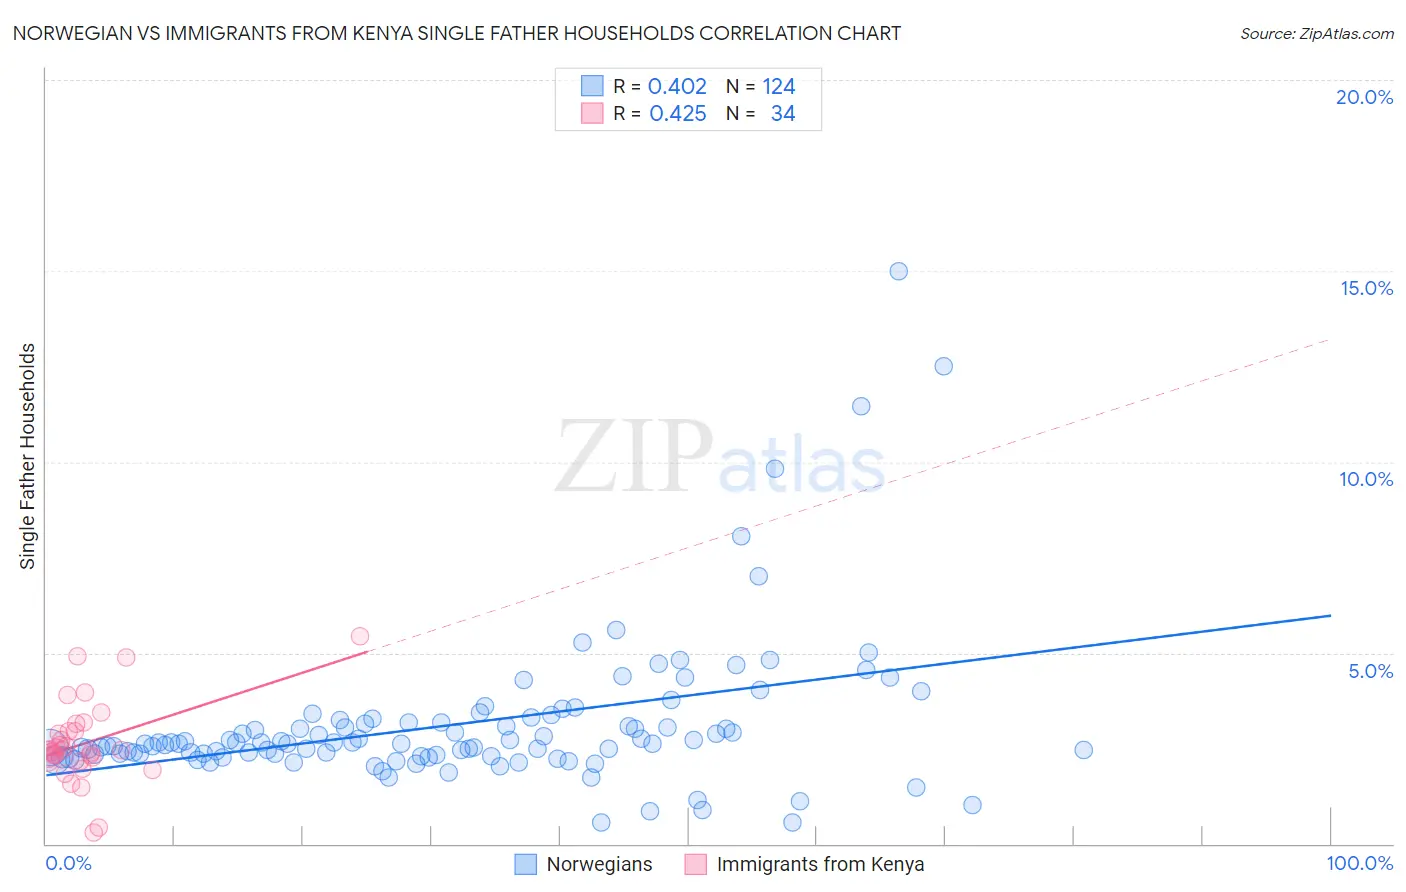
Norwegian vs Immigrants from Kenya Single Father Households Correlation Chart
The statistical analysis conducted on geographies consisting of 522,435,304 people shows a moderate positive correlation between the proportion of Norwegians and percentage of single father households in the United States with a correlation coefficient (R) of 0.402 and weighted average of 2.4%. Similarly, the statistical analysis conducted on geographies consisting of 217,370,278 people shows a moderate positive correlation between the proportion of Immigrants from Kenya and percentage of single father households in the United States with a correlation coefficient (R) of 0.425 and weighted average of 2.4%, a difference of 0.38%.
Single Father Households Correlation Summary
| Measurement | Norwegian | Immigrants from Kenya |
| Minimum | 0.55% | 0.28% |
| Maximum | 15.0% | 5.4% |
| Range | 14.5% | 5.2% |
| Mean | 3.1% | 2.6% |
| Median | 2.6% | 2.4% |
| Interquartile 25% (IQ1) | 2.3% | 2.2% |
| Interquartile 75% (IQ3) | 3.2% | 3.0% |
| Interquartile Range (IQR) | 0.86% | 0.71% |
| Standard Deviation (Sample) | 2.0% | 1.1% |
| Standard Deviation (Population) | 2.0% | 1.1% |
Demographics Similar to Norwegians and Immigrants from Kenya by Single Father Households
In terms of single father households, the demographic groups most similar to Norwegians are Ethiopian (2.4%, a difference of 0.060%), Finnish (2.4%, a difference of 0.15%), Immigrants from South Eastern Asia (2.4%, a difference of 0.16%), Immigrants from Nigeria (2.4%, a difference of 0.20%), and Immigrants from Costa Rica (2.4%, a difference of 0.25%). Similarly, the demographic groups most similar to Immigrants from Kenya are Immigrants from Peru (2.4%, a difference of 0.12%), Immigrants from Costa Rica (2.4%, a difference of 0.13%), Immigrants from Nigeria (2.4%, a difference of 0.18%), Finnish (2.4%, a difference of 0.23%), and White/Caucasian (2.4%, a difference of 0.25%).
| Demographics | Rating | Rank | Single Father Households |
| Peruvians | 27.1 /100 | #200 | Fair 2.4% |
| Immigrants | Uganda | 26.0 /100 | #201 | Fair 2.4% |
| German Russians | 25.7 /100 | #202 | Fair 2.4% |
| French Canadians | 24.7 /100 | #203 | Fair 2.4% |
| Ecuadorians | 24.5 /100 | #204 | Fair 2.4% |
| Immigrants | Afghanistan | 24.2 /100 | #205 | Fair 2.4% |
| Koreans | 24.1 /100 | #206 | Fair 2.4% |
| Whites/Caucasians | 22.6 /100 | #207 | Fair 2.4% |
| Immigrants | Kenya | 20.3 /100 | #208 | Fair 2.4% |
| Immigrants | Peru | 19.3 /100 | #209 | Poor 2.4% |
| Immigrants | Costa Rica | 19.2 /100 | #210 | Poor 2.4% |
| Immigrants | Nigeria | 18.7 /100 | #211 | Poor 2.4% |
| Finns | 18.3 /100 | #212 | Poor 2.4% |
| Norwegians | 17.1 /100 | #213 | Poor 2.4% |
| Ethiopians | 16.6 /100 | #214 | Poor 2.4% |
| Immigrants | South Eastern Asia | 15.9 /100 | #215 | Poor 2.4% |
| Immigrants | Ecuador | 14.9 /100 | #216 | Poor 2.4% |
| Dutch | 14.3 /100 | #217 | Poor 2.4% |
| Immigrants | Ethiopia | 13.4 /100 | #218 | Poor 2.4% |
| Sudanese | 13.0 /100 | #219 | Poor 2.4% |
| Ghanaians | 12.9 /100 | #220 | Poor 2.4% |