Norwegian vs Welsh Average Family Size
COMPARE
Norwegian
Welsh
Average Family Size
Average Family Size Comparison
Norwegians
Welsh
3.08
AVERAGE FAMILY SIZE
0.0/ 100
METRIC RATING
343rd/ 347
METRIC RANK
3.12
AVERAGE FAMILY SIZE
0.1/ 100
METRIC RATING
319th/ 347
METRIC RANK
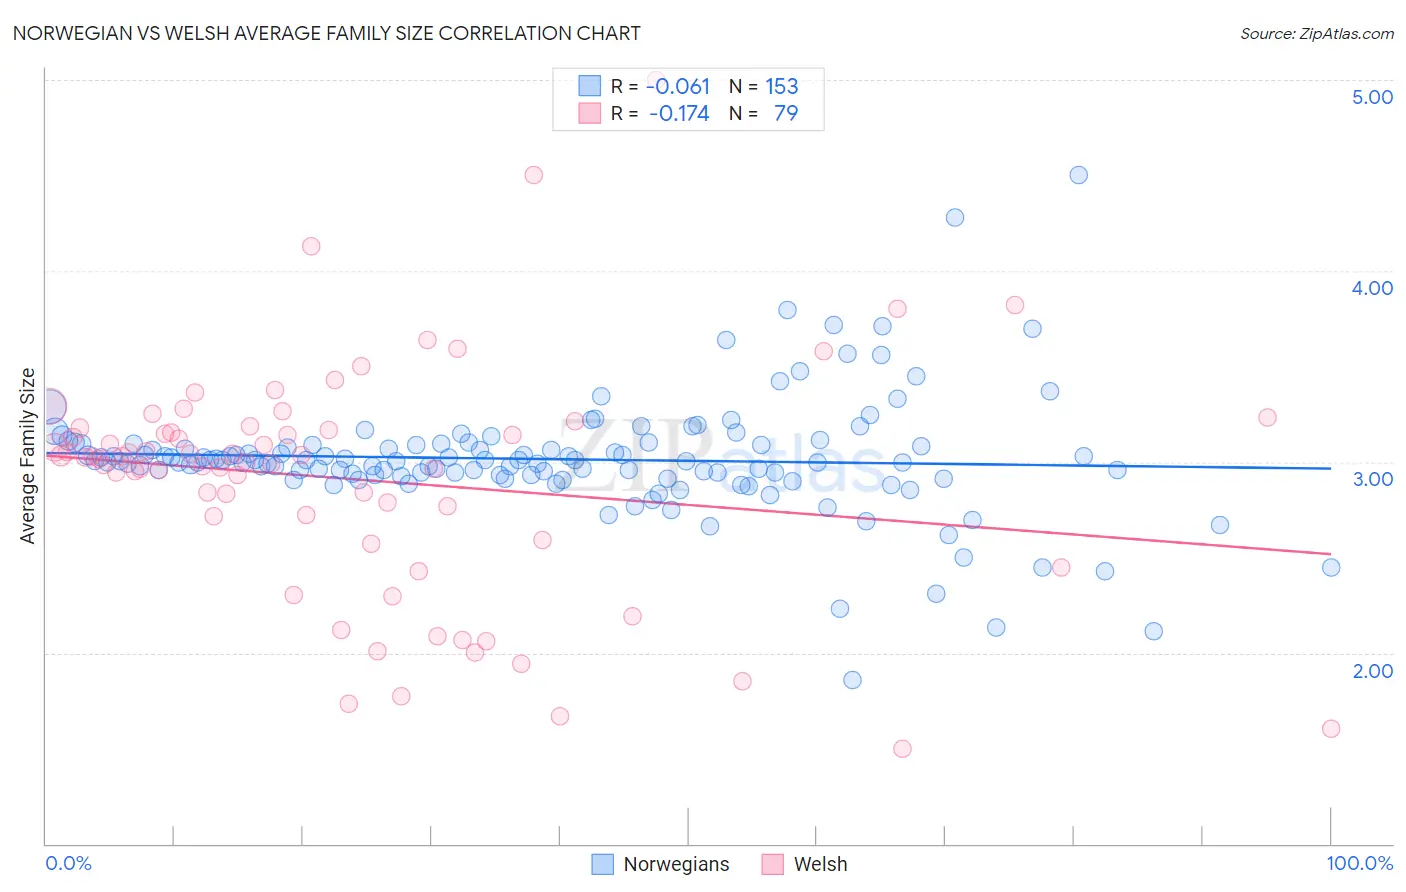
Norwegian vs Welsh Average Family Size Correlation Chart
The statistical analysis conducted on geographies consisting of 532,913,182 people shows a slight negative correlation between the proportion of Norwegians and average family size in the United States with a correlation coefficient (R) of -0.061 and weighted average of 3.08. Similarly, the statistical analysis conducted on geographies consisting of 528,179,662 people shows a poor negative correlation between the proportion of Welsh and average family size in the United States with a correlation coefficient (R) of -0.174 and weighted average of 3.12, a difference of 1.2%.
Average Family Size Correlation Summary
| Measurement | Norwegian | Welsh |
| Minimum | 1.86 | 1.50 |
| Maximum | 4.50 | 5.00 |
| Range | 2.64 | 3.50 |
| Mean | 3.01 | 2.91 |
| Median | 3.00 | 3.02 |
| Interquartile 25% (IQ1) | 2.93 | 2.59 |
| Interquartile 75% (IQ3) | 3.09 | 3.18 |
| Interquartile Range (IQR) | 0.16 | 0.59 |
| Standard Deviation (Sample) | 0.31 | 0.62 |
| Standard Deviation (Population) | 0.31 | 0.62 |
Similar Demographics by Average Family Size
Demographics Similar to Norwegians by Average Family Size
In terms of average family size, the demographic groups most similar to Norwegians are German (3.09, a difference of 0.23%), French Canadian (3.07, a difference of 0.24%), Slovene (3.07, a difference of 0.28%), Polish (3.09, a difference of 0.37%), and Finnish (3.09, a difference of 0.42%).
| Demographics | Rating | Rank | Average Family Size |
| Estonians | 0.0 /100 | #333 | Tragic 3.10 |
| Lithuanians | 0.0 /100 | #334 | Tragic 3.10 |
| Luxembourgers | 0.0 /100 | #335 | Tragic 3.10 |
| Irish | 0.0 /100 | #336 | Tragic 3.10 |
| Swedes | 0.0 /100 | #337 | Tragic 3.10 |
| French | 0.0 /100 | #338 | Tragic 3.10 |
| Croatians | 0.0 /100 | #339 | Tragic 3.10 |
| Finns | 0.0 /100 | #340 | Tragic 3.09 |
| Poles | 0.0 /100 | #341 | Tragic 3.09 |
| Germans | 0.0 /100 | #342 | Tragic 3.09 |
| Norwegians | 0.0 /100 | #343 | Tragic 3.08 |
| French Canadians | 0.0 /100 | #344 | Tragic 3.07 |
| Slovenes | 0.0 /100 | #345 | Tragic 3.07 |
| Slovaks | 0.0 /100 | #346 | Tragic 3.06 |
| Carpatho Rusyns | 0.0 /100 | #347 | Tragic 3.06 |
Demographics Similar to Welsh by Average Family Size
In terms of average family size, the demographic groups most similar to Welsh are Eastern European (3.12, a difference of 0.0%), Italian (3.12, a difference of 0.010%), Serbian (3.12, a difference of 0.070%), Immigrants from North America (3.12, a difference of 0.070%), and Immigrants from Austria (3.12, a difference of 0.10%).
| Demographics | Rating | Rank | Average Family Size |
| Immigrants | Australia | 0.1 /100 | #312 | Tragic 3.13 |
| Bulgarians | 0.1 /100 | #313 | Tragic 3.13 |
| Russians | 0.1 /100 | #314 | Tragic 3.12 |
| Immigrants | Scotland | 0.1 /100 | #315 | Tragic 3.12 |
| Serbians | 0.1 /100 | #316 | Tragic 3.12 |
| Italians | 0.1 /100 | #317 | Tragic 3.12 |
| Eastern Europeans | 0.1 /100 | #318 | Tragic 3.12 |
| Welsh | 0.1 /100 | #319 | Tragic 3.12 |
| Immigrants | North America | 0.0 /100 | #320 | Tragic 3.12 |
| Immigrants | Austria | 0.0 /100 | #321 | Tragic 3.12 |
| Immigrants | Canada | 0.0 /100 | #322 | Tragic 3.12 |
| Soviet Union | 0.0 /100 | #323 | Tragic 3.11 |
| Celtics | 0.0 /100 | #324 | Tragic 3.11 |
| English | 0.0 /100 | #325 | Tragic 3.11 |
| Ottawa | 0.0 /100 | #326 | Tragic 3.11 |