Norwegian vs Creek Average Family Size
COMPARE
Norwegian
Creek
Average Family Size
Average Family Size Comparison
Norwegians
Creek
3.08
AVERAGE FAMILY SIZE
0.0/ 100
METRIC RATING
343rd/ 347
METRIC RANK
3.20
AVERAGE FAMILY SIZE
12.1/ 100
METRIC RATING
212th/ 347
METRIC RANK
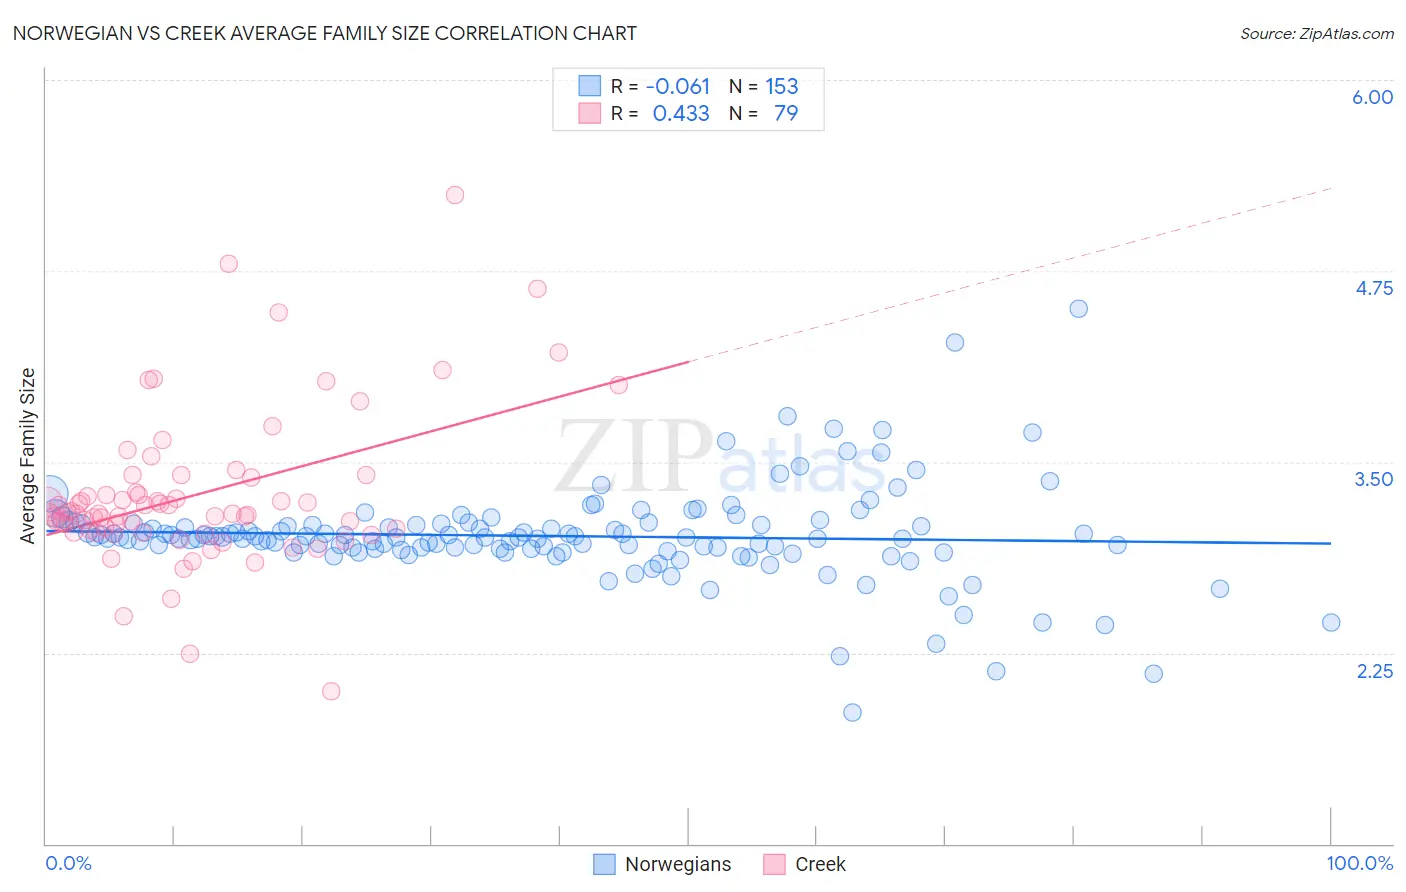
Norwegian vs Creek Average Family Size Correlation Chart
The statistical analysis conducted on geographies consisting of 532,913,182 people shows a slight negative correlation between the proportion of Norwegians and average family size in the United States with a correlation coefficient (R) of -0.061 and weighted average of 3.08. Similarly, the statistical analysis conducted on geographies consisting of 178,433,281 people shows a moderate positive correlation between the proportion of Creek and average family size in the United States with a correlation coefficient (R) of 0.433 and weighted average of 3.20, a difference of 3.8%.
Average Family Size Correlation Summary
| Measurement | Norwegian | Creek |
| Minimum | 1.86 | 2.00 |
| Maximum | 4.50 | 5.25 |
| Range | 2.64 | 3.25 |
| Mean | 3.01 | 3.29 |
| Median | 3.00 | 3.16 |
| Interquartile 25% (IQ1) | 2.93 | 3.04 |
| Interquartile 75% (IQ3) | 3.09 | 3.40 |
| Interquartile Range (IQR) | 0.16 | 0.36 |
| Standard Deviation (Sample) | 0.31 | 0.51 |
| Standard Deviation (Population) | 0.31 | 0.51 |
Similar Demographics by Average Family Size
Demographics Similar to Norwegians by Average Family Size
In terms of average family size, the demographic groups most similar to Norwegians are German (3.09, a difference of 0.23%), French Canadian (3.07, a difference of 0.24%), Slovene (3.07, a difference of 0.28%), Polish (3.09, a difference of 0.37%), and Finnish (3.09, a difference of 0.42%).
| Demographics | Rating | Rank | Average Family Size |
| Estonians | 0.0 /100 | #333 | Tragic 3.10 |
| Lithuanians | 0.0 /100 | #334 | Tragic 3.10 |
| Luxembourgers | 0.0 /100 | #335 | Tragic 3.10 |
| Irish | 0.0 /100 | #336 | Tragic 3.10 |
| Swedes | 0.0 /100 | #337 | Tragic 3.10 |
| French | 0.0 /100 | #338 | Tragic 3.10 |
| Croatians | 0.0 /100 | #339 | Tragic 3.10 |
| Finns | 0.0 /100 | #340 | Tragic 3.09 |
| Poles | 0.0 /100 | #341 | Tragic 3.09 |
| Germans | 0.0 /100 | #342 | Tragic 3.09 |
| Norwegians | 0.0 /100 | #343 | Tragic 3.08 |
| French Canadians | 0.0 /100 | #344 | Tragic 3.07 |
| Slovenes | 0.0 /100 | #345 | Tragic 3.07 |
| Slovaks | 0.0 /100 | #346 | Tragic 3.06 |
| Carpatho Rusyns | 0.0 /100 | #347 | Tragic 3.06 |
Demographics Similar to Creek by Average Family Size
In terms of average family size, the demographic groups most similar to Creek are Immigrants from Iran (3.20, a difference of 0.0%), Zimbabwean (3.20, a difference of 0.020%), Mongolian (3.20, a difference of 0.020%), Somali (3.20, a difference of 0.040%), and Chippewa (3.20, a difference of 0.050%).
| Demographics | Rating | Rank | Average Family Size |
| Paraguayans | 16.3 /100 | #205 | Poor 3.20 |
| Immigrants | Cabo Verde | 16.0 /100 | #206 | Poor 3.20 |
| Filipinos | 13.6 /100 | #207 | Poor 3.20 |
| Chippewa | 13.3 /100 | #208 | Poor 3.20 |
| Sudanese | 13.3 /100 | #209 | Poor 3.20 |
| Zimbabweans | 12.6 /100 | #210 | Poor 3.20 |
| Immigrants | Iran | 12.1 /100 | #211 | Poor 3.20 |
| Creek | 12.1 /100 | #212 | Poor 3.20 |
| Mongolians | 11.5 /100 | #213 | Poor 3.20 |
| Somalis | 11.2 /100 | #214 | Poor 3.20 |
| Delaware | 11.1 /100 | #215 | Poor 3.20 |
| Bermudans | 11.0 /100 | #216 | Poor 3.20 |
| Immigrants | Somalia | 10.3 /100 | #217 | Poor 3.20 |
| French American Indians | 9.8 /100 | #218 | Tragic 3.20 |
| Pennsylvania Germans | 9.3 /100 | #219 | Tragic 3.19 |