Ute vs British Single Mother Households
COMPARE
Ute
British
Single Mother Households
Single Mother Households Comparison
Ute
British
7.1%
SINGLE MOTHER HOUSEHOLDS
1.0/ 100
METRIC RATING
236th/ 347
METRIC RANK
5.8%
SINGLE MOTHER HOUSEHOLDS
95.5/ 100
METRIC RATING
110th/ 347
METRIC RANK
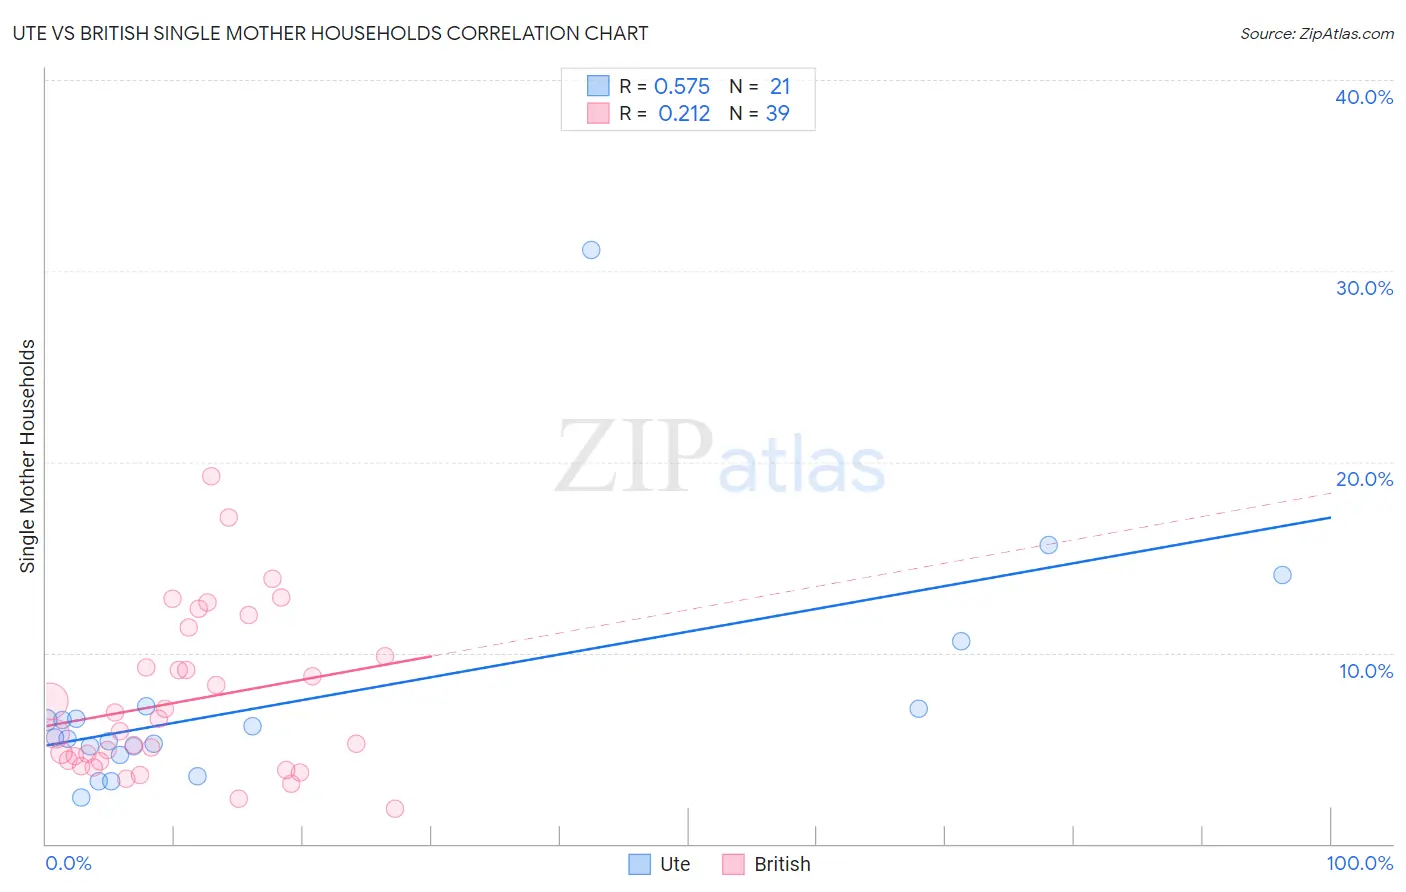
Ute vs British Single Mother Households Correlation Chart
The statistical analysis conducted on geographies consisting of 55,640,483 people shows a substantial positive correlation between the proportion of Ute and percentage of single mother households in the United States with a correlation coefficient (R) of 0.575 and weighted average of 7.1%. Similarly, the statistical analysis conducted on geographies consisting of 528,132,597 people shows a weak positive correlation between the proportion of British and percentage of single mother households in the United States with a correlation coefficient (R) of 0.212 and weighted average of 5.8%, a difference of 22.9%.
Single Mother Households Correlation Summary
| Measurement | Ute | British |
| Minimum | 2.4% | 1.8% |
| Maximum | 31.1% | 19.3% |
| Range | 28.6% | 17.5% |
| Mean | 7.6% | 7.5% |
| Median | 5.6% | 5.9% |
| Interquartile 25% (IQ1) | 4.9% | 4.3% |
| Interquartile 75% (IQ3) | 7.1% | 9.8% |
| Interquartile Range (IQR) | 2.3% | 5.5% |
| Standard Deviation (Sample) | 6.3% | 4.2% |
| Standard Deviation (Population) | 6.1% | 4.1% |
Similar Demographics by Single Mother Households
Demographics Similar to Ute by Single Mother Households
In terms of single mother households, the demographic groups most similar to Ute are Arapaho (7.1%, a difference of 0.090%), Panamanian (7.1%, a difference of 0.23%), Kiowa (7.1%, a difference of 0.50%), Immigrants from Burma/Myanmar (7.0%, a difference of 0.79%), and Immigrants from Panama (7.2%, a difference of 0.82%).
| Demographics | Rating | Rank | Single Mother Households |
| Immigrants | Kenya | 2.1 /100 | #229 | Tragic 7.0% |
| Creek | 1.6 /100 | #230 | Tragic 7.0% |
| Spanish Americans | 1.6 /100 | #231 | Tragic 7.0% |
| Comanche | 1.5 /100 | #232 | Tragic 7.0% |
| Choctaw | 1.4 /100 | #233 | Tragic 7.0% |
| Chickasaw | 1.4 /100 | #234 | Tragic 7.0% |
| Immigrants | Burma/Myanmar | 1.4 /100 | #235 | Tragic 7.0% |
| Ute | 1.0 /100 | #236 | Tragic 7.1% |
| Arapaho | 1.0 /100 | #237 | Tragic 7.1% |
| Panamanians | 0.9 /100 | #238 | Tragic 7.1% |
| Kiowa | 0.8 /100 | #239 | Tragic 7.1% |
| Immigrants | Panama | 0.7 /100 | #240 | Tragic 7.2% |
| Immigrants | Portugal | 0.6 /100 | #241 | Tragic 7.2% |
| Fijians | 0.6 /100 | #242 | Tragic 7.2% |
| Ecuadorians | 0.6 /100 | #243 | Tragic 7.2% |
Demographics Similar to British by Single Mother Households
In terms of single mother households, the demographic groups most similar to British are Immigrants from England (5.8%, a difference of 0.030%), Immigrants from Kuwait (5.8%, a difference of 0.070%), Immigrants from Western Europe (5.8%, a difference of 0.090%), Mongolian (5.8%, a difference of 0.14%), and Immigrants from Italy (5.8%, a difference of 0.18%).
| Demographics | Rating | Rank | Single Mother Households |
| Scottish | 96.2 /100 | #103 | Exceptional 5.8% |
| Northern Europeans | 96.2 /100 | #104 | Exceptional 5.8% |
| Taiwanese | 96.1 /100 | #105 | Exceptional 5.8% |
| Immigrants | Ukraine | 95.9 /100 | #106 | Exceptional 5.8% |
| Paraguayans | 95.8 /100 | #107 | Exceptional 5.8% |
| Immigrants | Italy | 95.8 /100 | #108 | Exceptional 5.8% |
| Immigrants | Western Europe | 95.7 /100 | #109 | Exceptional 5.8% |
| British | 95.5 /100 | #110 | Exceptional 5.8% |
| Immigrants | England | 95.5 /100 | #111 | Exceptional 5.8% |
| Immigrants | Kuwait | 95.4 /100 | #112 | Exceptional 5.8% |
| Mongolians | 95.3 /100 | #113 | Exceptional 5.8% |
| Dutch | 95.1 /100 | #114 | Exceptional 5.8% |
| Irish | 94.8 /100 | #115 | Exceptional 5.8% |
| Pennsylvania Germans | 94.7 /100 | #116 | Exceptional 5.8% |
| Bolivians | 94.6 /100 | #117 | Exceptional 5.8% |