Crow vs Mexican American Indian Family Households
COMPARE
Crow
Mexican American Indian
Family Households
Family Households Comparison
Crow
Mexican American Indians
65.3%
FAMILY HOUSEHOLDS
98.9/ 100
METRIC RATING
91st/ 347
METRIC RANK
67.0%
FAMILY HOUSEHOLDS
100.0/ 100
METRIC RATING
38th/ 347
METRIC RANK
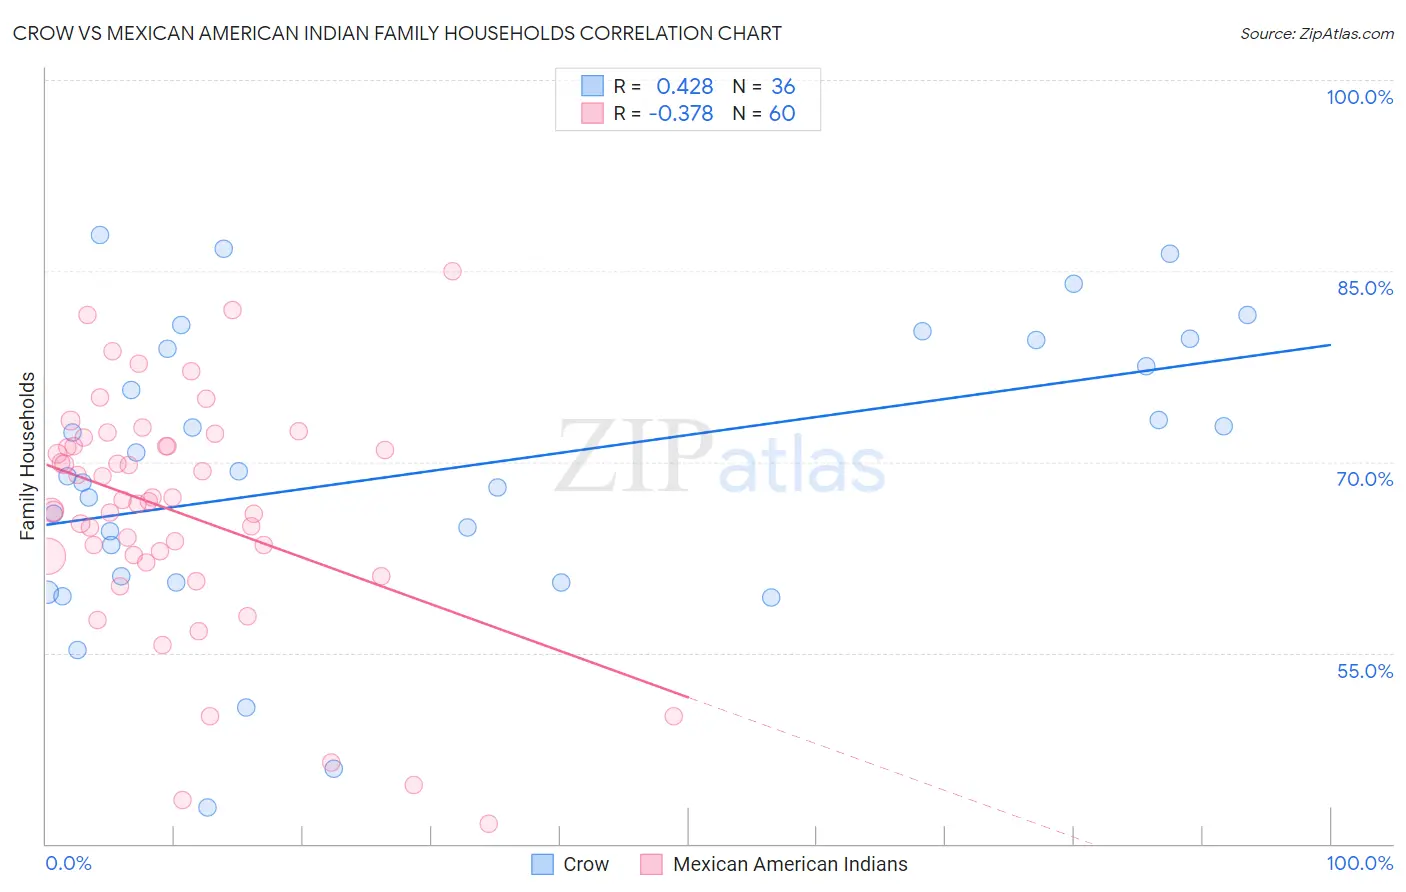
Crow vs Mexican American Indian Family Households Correlation Chart
The statistical analysis conducted on geographies consisting of 59,202,817 people shows a moderate positive correlation between the proportion of Crow and percentage of family households in the United States with a correlation coefficient (R) of 0.428 and weighted average of 65.3%. Similarly, the statistical analysis conducted on geographies consisting of 317,495,580 people shows a mild negative correlation between the proportion of Mexican American Indians and percentage of family households in the United States with a correlation coefficient (R) of -0.378 and weighted average of 67.0%, a difference of 2.6%.
Family Households Correlation Summary
| Measurement | Crow | Mexican American Indian |
| Minimum | 42.9% | 41.6% |
| Maximum | 87.9% | 85.0% |
| Range | 45.0% | 43.4% |
| Mean | 69.3% | 66.1% |
| Median | 69.0% | 67.0% |
| Interquartile 25% (IQ1) | 60.8% | 62.6% |
| Interquartile 75% (IQ3) | 79.2% | 71.3% |
| Interquartile Range (IQR) | 18.4% | 8.6% |
| Standard Deviation (Sample) | 11.2% | 9.1% |
| Standard Deviation (Population) | 11.1% | 9.0% |
Similar Demographics by Family Households
Demographics Similar to Crow by Family Households
In terms of family households, the demographic groups most similar to Crow are Hopi (65.3%, a difference of 0.040%), Immigrants from Laos (65.3%, a difference of 0.050%), Guyanese (65.3%, a difference of 0.050%), Immigrants from Caribbean (65.3%, a difference of 0.060%), and Immigrants from Poland (65.2%, a difference of 0.060%).
| Demographics | Rating | Rank | Family Households |
| Americans | 99.6 /100 | #84 | Exceptional 65.5% |
| Immigrants | Cambodia | 99.5 /100 | #85 | Exceptional 65.4% |
| Egyptians | 99.4 /100 | #86 | Exceptional 65.4% |
| Immigrants | Egypt | 99.2 /100 | #87 | Exceptional 65.3% |
| Immigrants | Haiti | 99.1 /100 | #88 | Exceptional 65.3% |
| Immigrants | Caribbean | 99.1 /100 | #89 | Exceptional 65.3% |
| Immigrants | Laos | 99.1 /100 | #90 | Exceptional 65.3% |
| Crow | 98.9 /100 | #91 | Exceptional 65.3% |
| Hopi | 98.8 /100 | #92 | Exceptional 65.3% |
| Guyanese | 98.8 /100 | #93 | Exceptional 65.3% |
| Immigrants | Poland | 98.7 /100 | #94 | Exceptional 65.2% |
| Immigrants | Portugal | 98.6 /100 | #95 | Exceptional 65.2% |
| Swiss | 98.6 /100 | #96 | Exceptional 65.2% |
| Guatemalans | 98.6 /100 | #97 | Exceptional 65.2% |
| Immigrants | Syria | 98.4 /100 | #98 | Exceptional 65.2% |
Demographics Similar to Mexican American Indians by Family Households
In terms of family households, the demographic groups most similar to Mexican American Indians are Immigrants from El Salvador (67.0%, a difference of 0.020%), Tsimshian (67.1%, a difference of 0.10%), Peruvian (67.1%, a difference of 0.17%), Tohono O'odham (67.1%, a difference of 0.18%), and Salvadoran (67.2%, a difference of 0.23%).
| Demographics | Rating | Rank | Family Households |
| Immigrants | Latin America | 100.0 /100 | #31 | Exceptional 67.2% |
| Nepalese | 100.0 /100 | #32 | Exceptional 67.2% |
| Salvadorans | 100.0 /100 | #33 | Exceptional 67.2% |
| Thais | 100.0 /100 | #34 | Exceptional 67.2% |
| Tohono O'odham | 100.0 /100 | #35 | Exceptional 67.1% |
| Peruvians | 100.0 /100 | #36 | Exceptional 67.1% |
| Tsimshian | 100.0 /100 | #37 | Exceptional 67.1% |
| Mexican American Indians | 100.0 /100 | #38 | Exceptional 67.0% |
| Immigrants | El Salvador | 100.0 /100 | #39 | Exceptional 67.0% |
| Guamanians/Chamorros | 100.0 /100 | #40 | Exceptional 66.6% |
| Immigrants | Bolivia | 100.0 /100 | #41 | Exceptional 66.6% |
| Menominee | 100.0 /100 | #42 | Exceptional 66.5% |
| Apache | 100.0 /100 | #43 | Exceptional 66.5% |
| Asians | 100.0 /100 | #44 | Exceptional 66.5% |
| Venezuelans | 100.0 /100 | #45 | Exceptional 66.5% |