Nonimmigrants vs Guatemalan Single Father Households
COMPARE
Nonimmigrants
Guatemalan
Single Father Households
Single Father Households Comparison
Nonimmigrants
Guatemalans
2.4%
SINGLE FATHER HOUSEHOLDS
7.6/ 100
METRIC RATING
231st/ 347
METRIC RANK
3.0%
SINGLE FATHER HOUSEHOLDS
0.0/ 100
METRIC RATING
320th/ 347
METRIC RANK
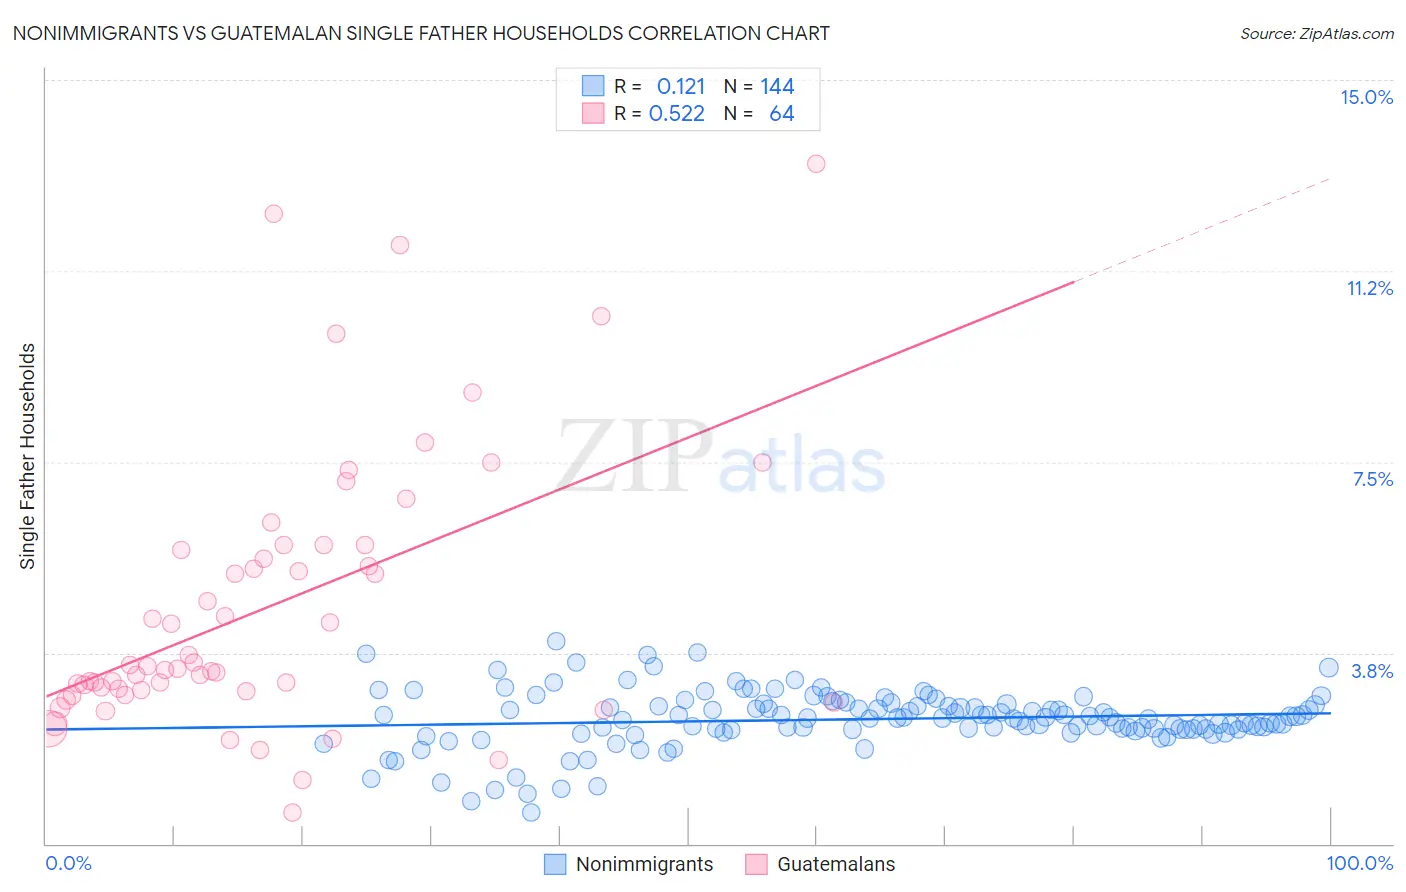
Nonimmigrants vs Guatemalan Single Father Households Correlation Chart
The statistical analysis conducted on geographies consisting of 565,890,376 people shows a poor positive correlation between the proportion of Nonimmigrants and percentage of single father households in the United States with a correlation coefficient (R) of 0.121 and weighted average of 2.4%. Similarly, the statistical analysis conducted on geographies consisting of 406,583,084 people shows a substantial positive correlation between the proportion of Guatemalans and percentage of single father households in the United States with a correlation coefficient (R) of 0.522 and weighted average of 3.0%, a difference of 21.2%.
Single Father Households Correlation Summary
| Measurement | Nonimmigrants | Guatemalan |
| Minimum | 0.62% | 0.62% |
| Maximum | 4.0% | 13.4% |
| Range | 3.4% | 12.7% |
| Mean | 2.4% | 4.6% |
| Median | 2.5% | 3.5% |
| Interquartile 25% (IQ1) | 2.2% | 3.0% |
| Interquartile 75% (IQ3) | 2.7% | 5.8% |
| Interquartile Range (IQR) | 0.48% | 2.8% |
| Standard Deviation (Sample) | 0.56% | 2.7% |
| Standard Deviation (Population) | 0.56% | 2.7% |
Similar Demographics by Single Father Households
Demographics Similar to Nonimmigrants by Single Father Households
In terms of single father households, the demographic groups most similar to Nonimmigrants are Pennsylvania German (2.4%, a difference of 0.080%), Immigrants from Western Africa (2.4%, a difference of 0.14%), Subsaharan African (2.4%, a difference of 0.16%), Immigrants from Zaire (2.4%, a difference of 0.25%), and African (2.5%, a difference of 0.34%).
| Demographics | Rating | Rank | Single Father Households |
| Immigrants | Bahamas | 10.6 /100 | #224 | Poor 2.4% |
| Marshallese | 9.7 /100 | #225 | Tragic 2.4% |
| Blacks/African Americans | 9.7 /100 | #226 | Tragic 2.4% |
| Americans | 9.3 /100 | #227 | Tragic 2.4% |
| Immigrants | Ghana | 9.1 /100 | #228 | Tragic 2.4% |
| Immigrants | Zaire | 8.6 /100 | #229 | Tragic 2.4% |
| Sub-Saharan Africans | 8.3 /100 | #230 | Tragic 2.4% |
| Immigrants | Nonimmigrants | 7.6 /100 | #231 | Tragic 2.4% |
| Pennsylvania Germans | 7.3 /100 | #232 | Tragic 2.4% |
| Immigrants | Western Africa | 7.0 /100 | #233 | Tragic 2.4% |
| Africans | 6.3 /100 | #234 | Tragic 2.5% |
| Immigrants | Immigrants | 6.3 /100 | #235 | Tragic 2.5% |
| Cajuns | 6.1 /100 | #236 | Tragic 2.5% |
| Sierra Leoneans | 5.9 /100 | #237 | Tragic 2.5% |
| Immigrants | Sierra Leone | 5.8 /100 | #238 | Tragic 2.5% |
Demographics Similar to Guatemalans by Single Father Households
In terms of single father households, the demographic groups most similar to Guatemalans are Ute (3.0%, a difference of 0.080%), Mexican (3.0%, a difference of 0.39%), Cape Verdean (2.9%, a difference of 0.61%), Immigrants from El Salvador (2.9%, a difference of 0.62%), and Immigrants from Guatemala (3.0%, a difference of 0.92%).
| Demographics | Rating | Rank | Single Father Households |
| Arapaho | 0.0 /100 | #313 | Tragic 2.9% |
| Salvadorans | 0.0 /100 | #314 | Tragic 2.9% |
| Cheyenne | 0.0 /100 | #315 | Tragic 2.9% |
| Houma | 0.0 /100 | #316 | Tragic 2.9% |
| Immigrants | El Salvador | 0.0 /100 | #317 | Tragic 2.9% |
| Cape Verdeans | 0.0 /100 | #318 | Tragic 2.9% |
| Ute | 0.0 /100 | #319 | Tragic 3.0% |
| Guatemalans | 0.0 /100 | #320 | Tragic 3.0% |
| Mexicans | 0.0 /100 | #321 | Tragic 3.0% |
| Immigrants | Guatemala | 0.0 /100 | #322 | Tragic 3.0% |
| Immigrants | Central America | 0.0 /100 | #323 | Tragic 3.0% |
| Fijians | 0.0 /100 | #324 | Tragic 3.0% |
| Immigrants | Mexico | 0.0 /100 | #325 | Tragic 3.0% |
| Aleuts | 0.0 /100 | #326 | Tragic 3.0% |
| Bangladeshis | 0.0 /100 | #327 | Tragic 3.1% |