Nonimmigrants vs Chinese Unemployment Among Ages 65 to 74 years
COMPARE
Nonimmigrants
Chinese
Unemployment Among Ages 65 to 74 years
Unemployment Among Ages 65 to 74 years Comparison
Nonimmigrants
Chinese
5.4%
UNEMPLOYMENT AMONG AGES 65 TO 74 YEARS
30.6/ 100
METRIC RATING
187th/ 347
METRIC RANK
4.4%
UNEMPLOYMENT AMONG AGES 65 TO 74 YEARS
100.0/ 100
METRIC RATING
2nd/ 347
METRIC RANK
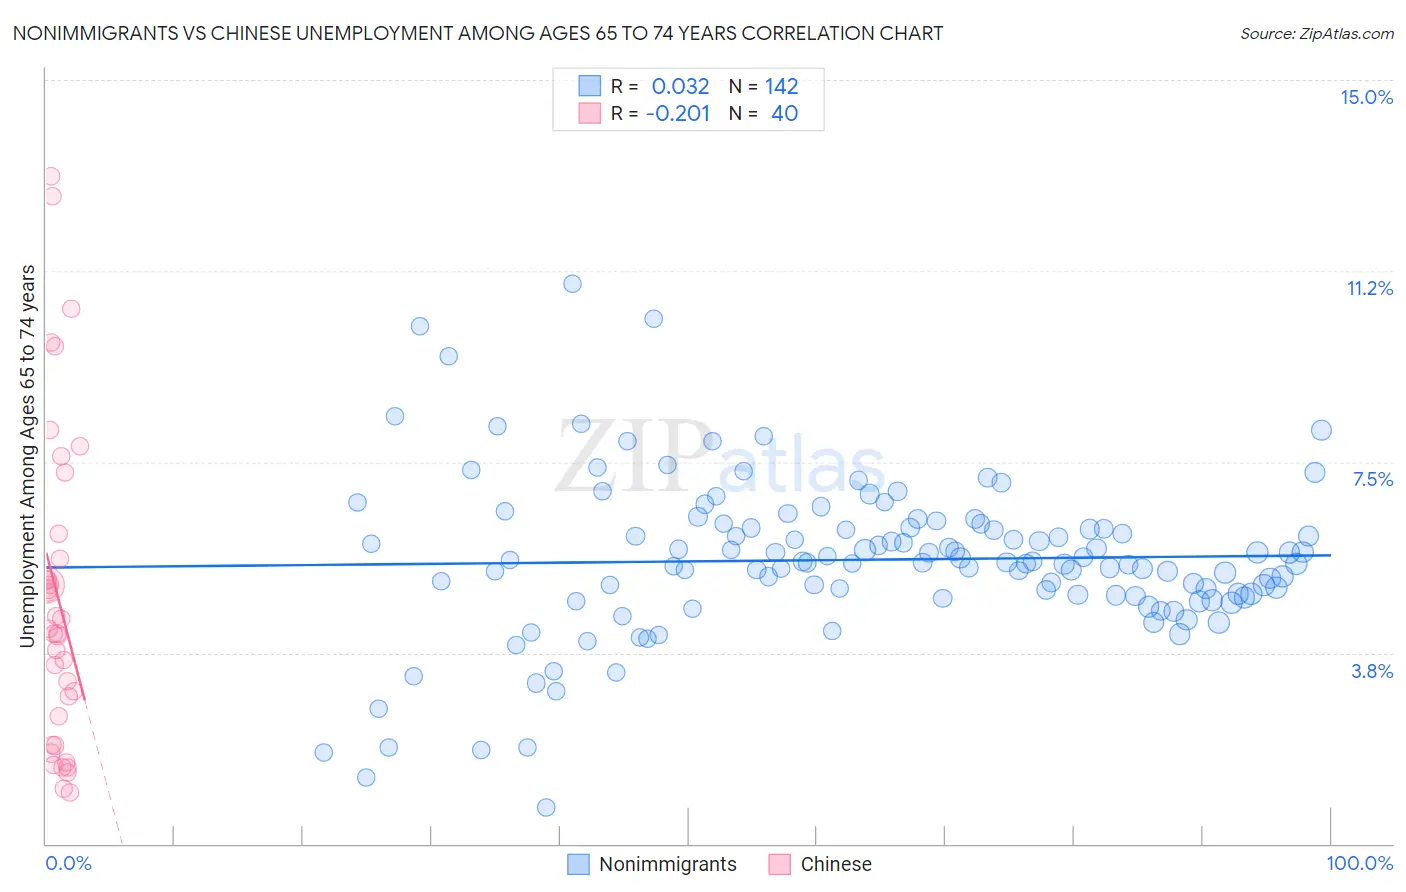
Nonimmigrants vs Chinese Unemployment Among Ages 65 to 74 years Correlation Chart
The statistical analysis conducted on geographies consisting of 445,501,442 people shows no correlation between the proportion of Nonimmigrants and unemployment rate among population between the ages 65 and 74 in the United States with a correlation coefficient (R) of 0.032 and weighted average of 5.4%. Similarly, the statistical analysis conducted on geographies consisting of 62,031,641 people shows a weak negative correlation between the proportion of Chinese and unemployment rate among population between the ages 65 and 74 in the United States with a correlation coefficient (R) of -0.201 and weighted average of 4.4%, a difference of 21.5%.
Unemployment Among Ages 65 to 74 years Correlation Summary
| Measurement | Nonimmigrants | Chinese |
| Minimum | 0.70% | 1.0% |
| Maximum | 11.0% | 13.1% |
| Range | 10.3% | 12.1% |
| Mean | 5.6% | 4.8% |
| Median | 5.5% | 4.2% |
| Interquartile 25% (IQ1) | 4.9% | 2.2% |
| Interquartile 75% (IQ3) | 6.2% | 5.8% |
| Interquartile Range (IQR) | 1.3% | 3.6% |
| Standard Deviation (Sample) | 1.6% | 3.1% |
| Standard Deviation (Population) | 1.6% | 3.1% |
Similar Demographics by Unemployment Among Ages 65 to 74 years
Demographics Similar to Nonimmigrants by Unemployment Among Ages 65 to 74 years
In terms of unemployment among ages 65 to 74 years, the demographic groups most similar to Nonimmigrants are Lithuanian (5.4%, a difference of 0.070%), Immigrants from Europe (5.4%, a difference of 0.070%), Immigrants from Africa (5.4%, a difference of 0.090%), Russian (5.4%, a difference of 0.14%), and Basque (5.4%, a difference of 0.16%).
| Demographics | Rating | Rank | Unemployment Among Ages 65 to 74 years |
| Immigrants | Ireland | 42.0 /100 | #180 | Average 5.4% |
| Soviet Union | 40.0 /100 | #181 | Fair 5.4% |
| Spanish Americans | 38.2 /100 | #182 | Fair 5.4% |
| Immigrants | Spain | 37.3 /100 | #183 | Fair 5.4% |
| Immigrants | Senegal | 35.2 /100 | #184 | Fair 5.4% |
| Russians | 34.4 /100 | #185 | Fair 5.4% |
| Lithuanians | 32.4 /100 | #186 | Fair 5.4% |
| Immigrants | Nonimmigrants | 30.6 /100 | #187 | Fair 5.4% |
| Immigrants | Europe | 28.8 /100 | #188 | Fair 5.4% |
| Immigrants | Africa | 28.3 /100 | #189 | Fair 5.4% |
| Basques | 26.6 /100 | #190 | Fair 5.4% |
| Immigrants | Egypt | 26.5 /100 | #191 | Fair 5.4% |
| Maltese | 26.4 /100 | #192 | Fair 5.4% |
| Cherokee | 25.8 /100 | #193 | Fair 5.4% |
| Immigrants | Denmark | 24.7 /100 | #194 | Fair 5.4% |
Demographics Similar to Chinese by Unemployment Among Ages 65 to 74 years
In terms of unemployment among ages 65 to 74 years, the demographic groups most similar to Chinese are Fijian (4.5%, a difference of 1.6%), Tsimshian (4.6%, a difference of 3.1%), Sudanese (4.6%, a difference of 3.5%), Immigrants from Cuba (4.6%, a difference of 4.0%), and Indonesian (4.7%, a difference of 5.5%).
| Demographics | Rating | Rank | Unemployment Among Ages 65 to 74 years |
| Hmong | 100.0 /100 | #1 | Exceptional 4.2% |
| Chinese | 100.0 /100 | #2 | Exceptional 4.4% |
| Fijians | 100.0 /100 | #3 | Exceptional 4.5% |
| Tsimshian | 100.0 /100 | #4 | Exceptional 4.6% |
| Sudanese | 100.0 /100 | #5 | Exceptional 4.6% |
| Immigrants | Cuba | 100.0 /100 | #6 | Exceptional 4.6% |
| Indonesians | 100.0 /100 | #7 | Exceptional 4.7% |
| Comanche | 100.0 /100 | #8 | Exceptional 4.7% |
| Chickasaw | 100.0 /100 | #9 | Exceptional 4.7% |
| Osage | 100.0 /100 | #10 | Exceptional 4.7% |
| Immigrants | Congo | 100.0 /100 | #11 | Exceptional 4.7% |
| Tongans | 100.0 /100 | #12 | Exceptional 4.7% |
| Lumbee | 100.0 /100 | #13 | Exceptional 4.8% |
| Cubans | 100.0 /100 | #14 | Exceptional 4.8% |
| Immigrants | North Macedonia | 100.0 /100 | #15 | Exceptional 4.8% |