Nigerian vs Norwegian Average Family Size
COMPARE
Nigerian
Norwegian
Average Family Size
Average Family Size Comparison
Nigerians
Norwegians
3.29
AVERAGE FAMILY SIZE
98.6/ 100
METRIC RATING
99th/ 347
METRIC RANK
3.08
AVERAGE FAMILY SIZE
0.0/ 100
METRIC RATING
343rd/ 347
METRIC RANK
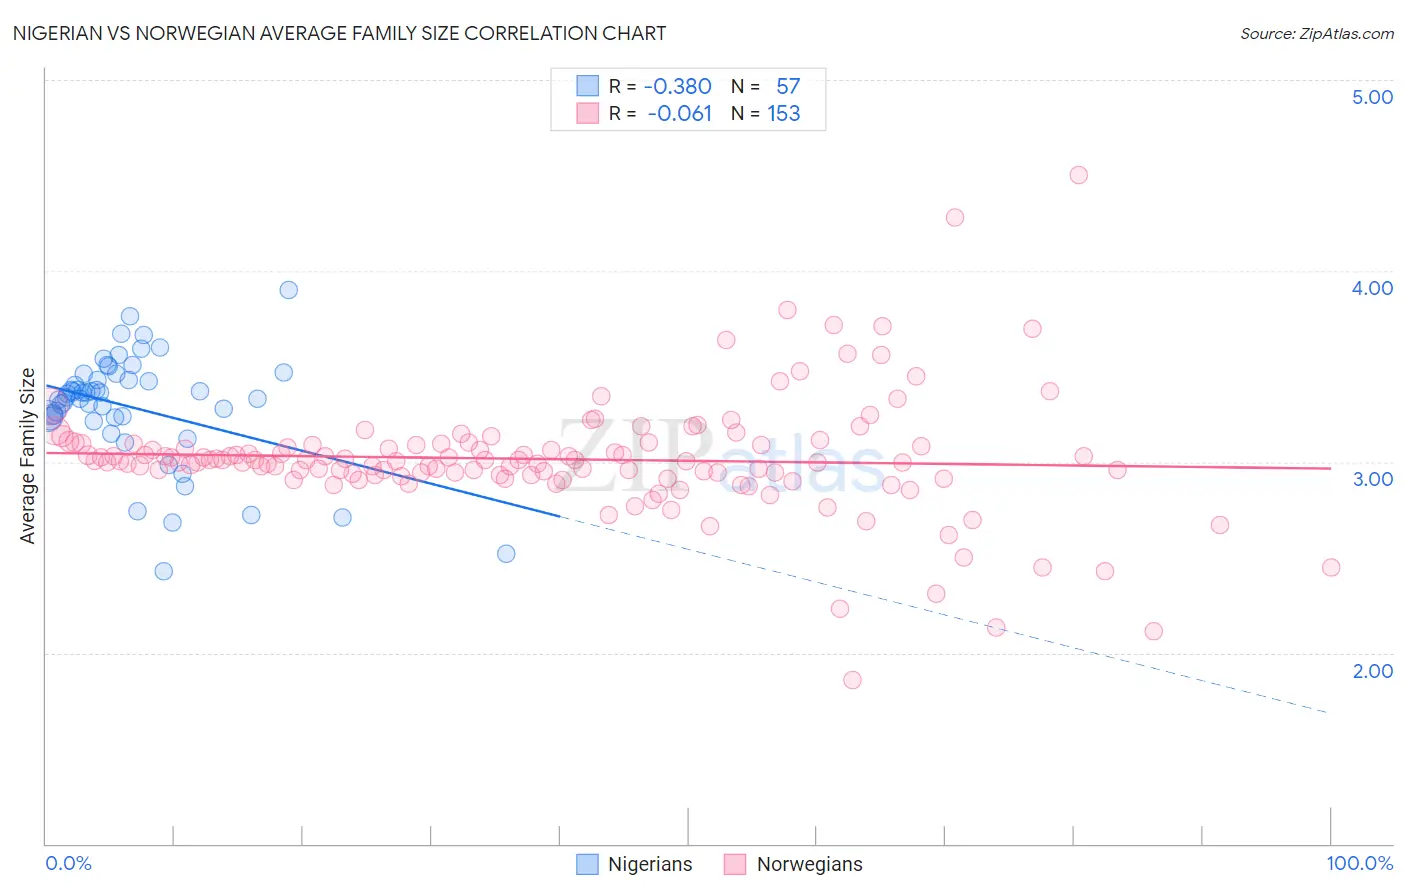
Nigerian vs Norwegian Average Family Size Correlation Chart
The statistical analysis conducted on geographies consisting of 332,464,526 people shows a mild negative correlation between the proportion of Nigerians and average family size in the United States with a correlation coefficient (R) of -0.380 and weighted average of 3.29. Similarly, the statistical analysis conducted on geographies consisting of 532,913,182 people shows a slight negative correlation between the proportion of Norwegians and average family size in the United States with a correlation coefficient (R) of -0.061 and weighted average of 3.08, a difference of 6.8%.
Average Family Size Correlation Summary
| Measurement | Nigerian | Norwegian |
| Minimum | 2.43 | 1.86 |
| Maximum | 3.90 | 4.50 |
| Range | 1.47 | 2.64 |
| Mean | 3.28 | 3.01 |
| Median | 3.34 | 3.00 |
| Interquartile 25% (IQ1) | 3.23 | 2.93 |
| Interquartile 75% (IQ3) | 3.45 | 3.09 |
| Interquartile Range (IQR) | 0.22 | 0.16 |
| Standard Deviation (Sample) | 0.29 | 0.31 |
| Standard Deviation (Population) | 0.29 | 0.31 |
Similar Demographics by Average Family Size
Demographics Similar to Nigerians by Average Family Size
In terms of average family size, the demographic groups most similar to Nigerians are Barbadian (3.29, a difference of 0.0%), Immigrants from Oceania (3.29, a difference of 0.010%), Guamanian/Chamorro (3.29, a difference of 0.010%), Immigrants from Burma/Myanmar (3.29, a difference of 0.020%), and West Indian (3.29, a difference of 0.030%).
| Demographics | Rating | Rank | Average Family Size |
| Immigrants | Cameroon | 99.2 /100 | #92 | Exceptional 3.30 |
| Peruvians | 99.2 /100 | #93 | Exceptional 3.30 |
| Sierra Leoneans | 99.0 /100 | #94 | Exceptional 3.30 |
| Immigrants | Lebanon | 99.0 /100 | #95 | Exceptional 3.30 |
| U.S. Virgin Islanders | 98.8 /100 | #96 | Exceptional 3.29 |
| Immigrants | Oceania | 98.7 /100 | #97 | Exceptional 3.29 |
| Barbadians | 98.6 /100 | #98 | Exceptional 3.29 |
| Nigerians | 98.6 /100 | #99 | Exceptional 3.29 |
| Guamanians/Chamorros | 98.6 /100 | #100 | Exceptional 3.29 |
| Immigrants | Burma/Myanmar | 98.6 /100 | #101 | Exceptional 3.29 |
| West Indians | 98.5 /100 | #102 | Exceptional 3.29 |
| Immigrants | Western Africa | 98.4 /100 | #103 | Exceptional 3.29 |
| Bolivians | 98.3 /100 | #104 | Exceptional 3.29 |
| Immigrants | Ghana | 98.1 /100 | #105 | Exceptional 3.29 |
| Paiute | 98.0 /100 | #106 | Exceptional 3.29 |
Demographics Similar to Norwegians by Average Family Size
In terms of average family size, the demographic groups most similar to Norwegians are German (3.09, a difference of 0.23%), French Canadian (3.07, a difference of 0.24%), Slovene (3.07, a difference of 0.28%), Polish (3.09, a difference of 0.37%), and Finnish (3.09, a difference of 0.42%).
| Demographics | Rating | Rank | Average Family Size |
| Estonians | 0.0 /100 | #333 | Tragic 3.10 |
| Lithuanians | 0.0 /100 | #334 | Tragic 3.10 |
| Luxembourgers | 0.0 /100 | #335 | Tragic 3.10 |
| Irish | 0.0 /100 | #336 | Tragic 3.10 |
| Swedes | 0.0 /100 | #337 | Tragic 3.10 |
| French | 0.0 /100 | #338 | Tragic 3.10 |
| Croatians | 0.0 /100 | #339 | Tragic 3.10 |
| Finns | 0.0 /100 | #340 | Tragic 3.09 |
| Poles | 0.0 /100 | #341 | Tragic 3.09 |
| Germans | 0.0 /100 | #342 | Tragic 3.09 |
| Norwegians | 0.0 /100 | #343 | Tragic 3.08 |
| French Canadians | 0.0 /100 | #344 | Tragic 3.07 |
| Slovenes | 0.0 /100 | #345 | Tragic 3.07 |
| Slovaks | 0.0 /100 | #346 | Tragic 3.06 |
| Carpatho Rusyns | 0.0 /100 | #347 | Tragic 3.06 |