Dominican vs Norwegian Average Family Size
COMPARE
Dominican
Norwegian
Average Family Size
Average Family Size Comparison
Dominicans
Norwegians
3.34
AVERAGE FAMILY SIZE
99.9/ 100
METRIC RATING
64th/ 347
METRIC RANK
3.08
AVERAGE FAMILY SIZE
0.0/ 100
METRIC RATING
343rd/ 347
METRIC RANK
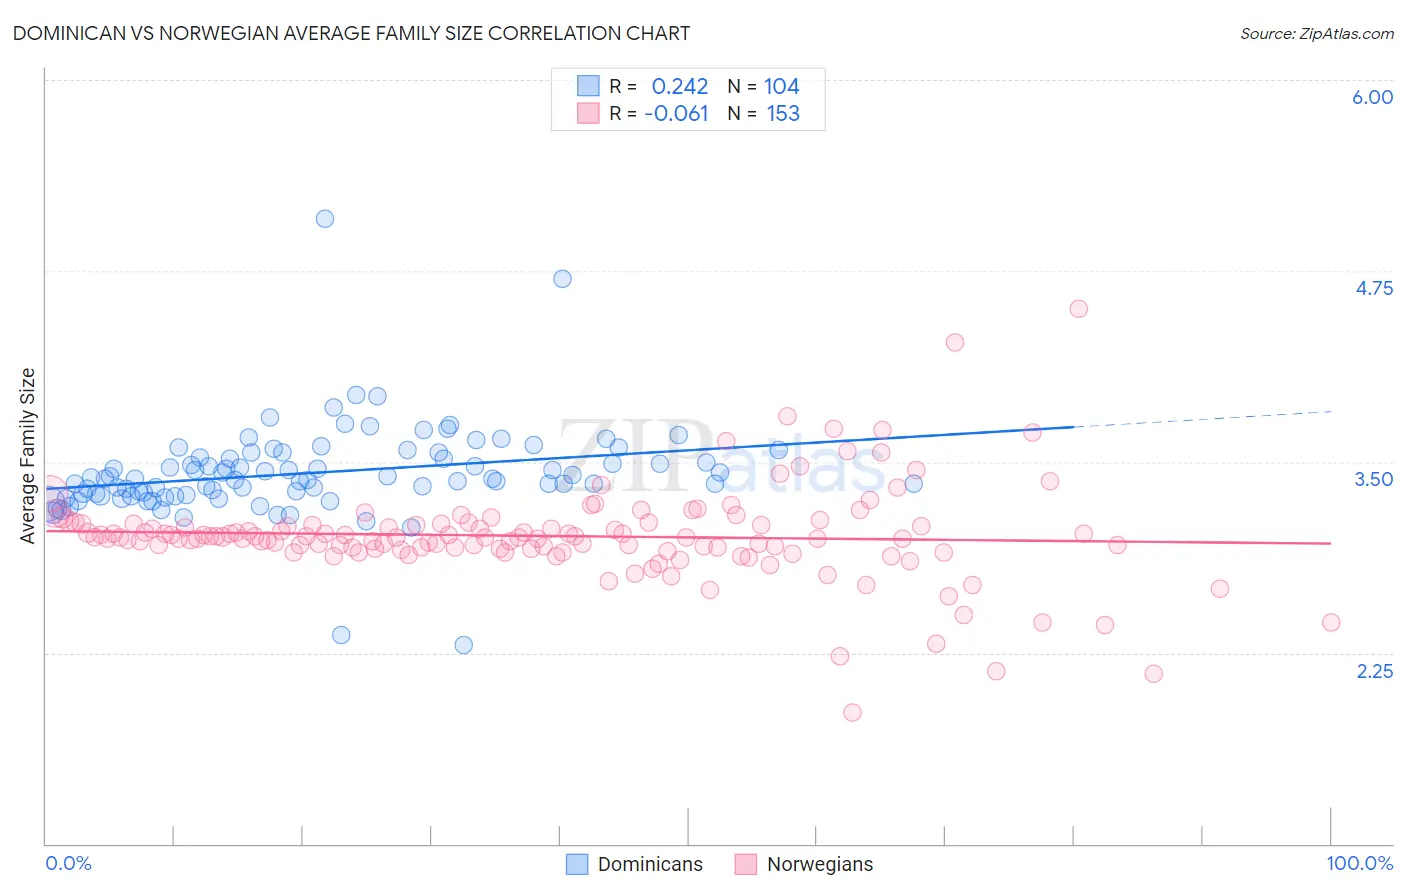
Dominican vs Norwegian Average Family Size Correlation Chart
The statistical analysis conducted on geographies consisting of 354,765,302 people shows a weak positive correlation between the proportion of Dominicans and average family size in the United States with a correlation coefficient (R) of 0.242 and weighted average of 3.34. Similarly, the statistical analysis conducted on geographies consisting of 532,913,182 people shows a slight negative correlation between the proportion of Norwegians and average family size in the United States with a correlation coefficient (R) of -0.061 and weighted average of 3.08, a difference of 8.3%.
Average Family Size Correlation Summary
| Measurement | Dominican | Norwegian |
| Minimum | 2.30 | 1.86 |
| Maximum | 5.09 | 4.50 |
| Range | 2.79 | 2.64 |
| Mean | 3.43 | 3.01 |
| Median | 3.39 | 3.00 |
| Interquartile 25% (IQ1) | 3.29 | 2.93 |
| Interquartile 75% (IQ3) | 3.54 | 3.09 |
| Interquartile Range (IQR) | 0.26 | 0.16 |
| Standard Deviation (Sample) | 0.31 | 0.31 |
| Standard Deviation (Population) | 0.31 | 0.31 |
Similar Demographics by Average Family Size
Demographics Similar to Dominicans by Average Family Size
In terms of average family size, the demographic groups most similar to Dominicans are Immigrants from Laos (3.34, a difference of 0.020%), Chinese (3.34, a difference of 0.070%), Immigrants from St. Vincent and the Grenadines (3.34, a difference of 0.080%), Immigrants from Grenada (3.34, a difference of 0.090%), and Immigrants from Jamaica (3.33, a difference of 0.12%).
| Demographics | Rating | Rank | Average Family Size |
| Sri Lankans | 100.0 /100 | #57 | Exceptional 3.35 |
| Hondurans | 100.0 /100 | #58 | Exceptional 3.35 |
| Japanese | 100.0 /100 | #59 | Exceptional 3.35 |
| Immigrants | Armenia | 100.0 /100 | #60 | Exceptional 3.35 |
| Central American Indians | 100.0 /100 | #61 | Exceptional 3.35 |
| Immigrants | Grenada | 100.0 /100 | #62 | Exceptional 3.34 |
| Chinese | 100.0 /100 | #63 | Exceptional 3.34 |
| Dominicans | 99.9 /100 | #64 | Exceptional 3.34 |
| Immigrants | Laos | 99.9 /100 | #65 | Exceptional 3.34 |
| Immigrants | St. Vincent and the Grenadines | 99.9 /100 | #66 | Exceptional 3.34 |
| Immigrants | Jamaica | 99.9 /100 | #67 | Exceptional 3.33 |
| Immigrants | Cambodia | 99.9 /100 | #68 | Exceptional 3.33 |
| Immigrants | Immigrants | 99.9 /100 | #69 | Exceptional 3.33 |
| Immigrants | Trinidad and Tobago | 99.9 /100 | #70 | Exceptional 3.33 |
| Immigrants | West Indies | 99.9 /100 | #71 | Exceptional 3.33 |
Demographics Similar to Norwegians by Average Family Size
In terms of average family size, the demographic groups most similar to Norwegians are German (3.09, a difference of 0.23%), French Canadian (3.07, a difference of 0.24%), Slovene (3.07, a difference of 0.28%), Polish (3.09, a difference of 0.37%), and Finnish (3.09, a difference of 0.42%).
| Demographics | Rating | Rank | Average Family Size |
| Estonians | 0.0 /100 | #333 | Tragic 3.10 |
| Lithuanians | 0.0 /100 | #334 | Tragic 3.10 |
| Luxembourgers | 0.0 /100 | #335 | Tragic 3.10 |
| Irish | 0.0 /100 | #336 | Tragic 3.10 |
| Swedes | 0.0 /100 | #337 | Tragic 3.10 |
| French | 0.0 /100 | #338 | Tragic 3.10 |
| Croatians | 0.0 /100 | #339 | Tragic 3.10 |
| Finns | 0.0 /100 | #340 | Tragic 3.09 |
| Poles | 0.0 /100 | #341 | Tragic 3.09 |
| Germans | 0.0 /100 | #342 | Tragic 3.09 |
| Norwegians | 0.0 /100 | #343 | Tragic 3.08 |
| French Canadians | 0.0 /100 | #344 | Tragic 3.07 |
| Slovenes | 0.0 /100 | #345 | Tragic 3.07 |
| Slovaks | 0.0 /100 | #346 | Tragic 3.06 |
| Carpatho Rusyns | 0.0 /100 | #347 | Tragic 3.06 |