Soviet Union vs Norwegian Average Family Size
COMPARE
Soviet Union
Norwegian
Average Family Size
Average Family Size Comparison
Soviet Union
Norwegians
3.11
AVERAGE FAMILY SIZE
0.0/ 100
METRIC RATING
323rd/ 347
METRIC RANK
3.08
AVERAGE FAMILY SIZE
0.0/ 100
METRIC RATING
343rd/ 347
METRIC RANK
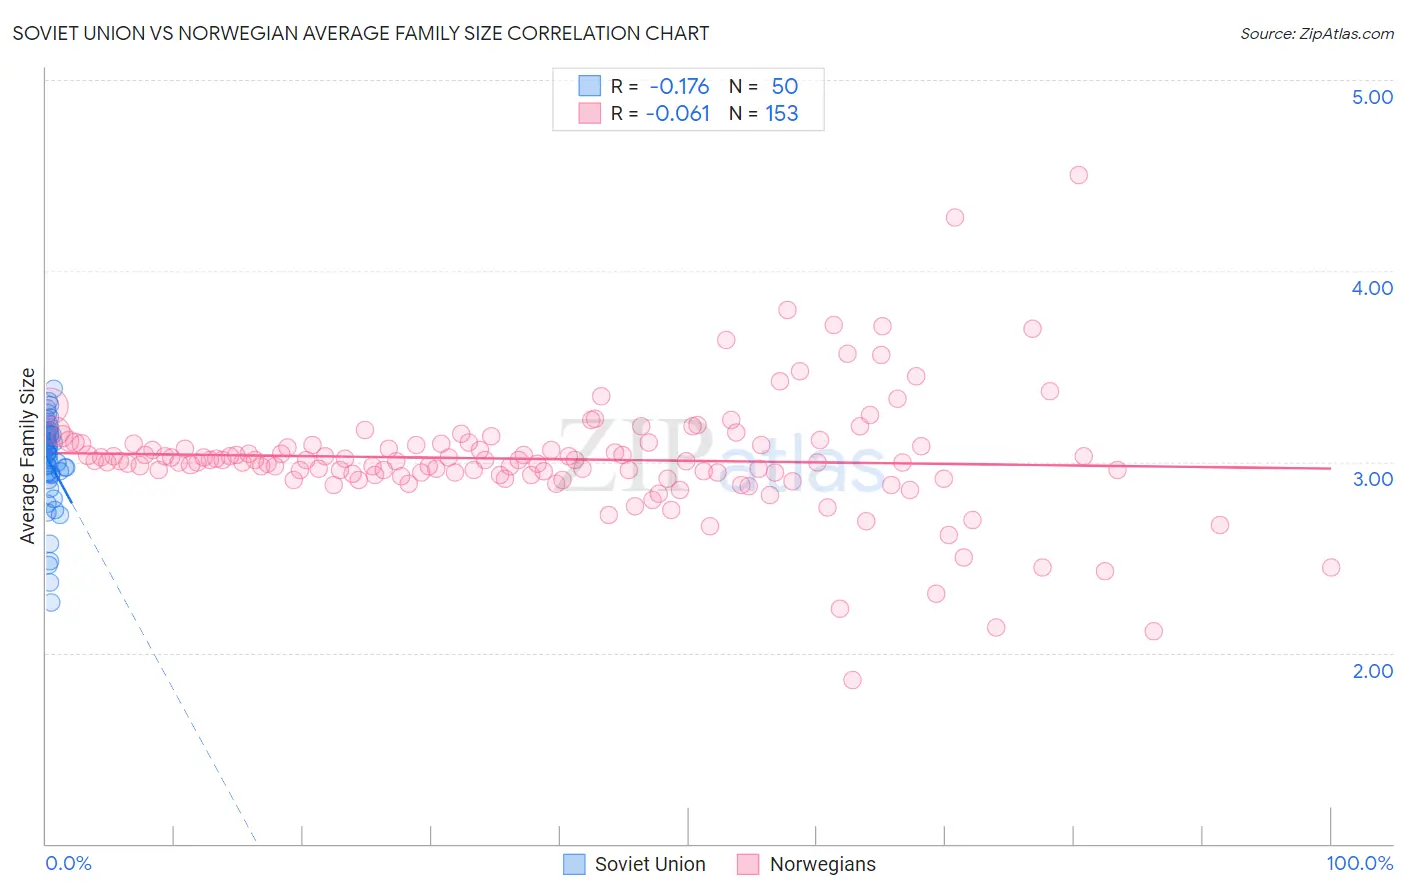
Soviet Union vs Norwegian Average Family Size Correlation Chart
The statistical analysis conducted on geographies consisting of 43,509,630 people shows a poor negative correlation between the proportion of Soviet Union and average family size in the United States with a correlation coefficient (R) of -0.176 and weighted average of 3.11. Similarly, the statistical analysis conducted on geographies consisting of 532,913,182 people shows a slight negative correlation between the proportion of Norwegians and average family size in the United States with a correlation coefficient (R) of -0.061 and weighted average of 3.08, a difference of 1.1%.
Average Family Size Correlation Summary
| Measurement | Soviet Union | Norwegian |
| Minimum | 2.27 | 1.86 |
| Maximum | 3.38 | 4.50 |
| Range | 1.11 | 2.64 |
| Mean | 2.99 | 3.01 |
| Median | 3.05 | 3.00 |
| Interquartile 25% (IQ1) | 2.93 | 2.93 |
| Interquartile 75% (IQ3) | 3.15 | 3.09 |
| Interquartile Range (IQR) | 0.22 | 0.16 |
| Standard Deviation (Sample) | 0.24 | 0.31 |
| Standard Deviation (Population) | 0.24 | 0.31 |
Demographics Similar to Soviet Union and Norwegians by Average Family Size
In terms of average family size, the demographic groups most similar to Soviet Union are Celtic (3.11, a difference of 0.080%), English (3.11, a difference of 0.12%), Ottawa (3.11, a difference of 0.17%), Dutch (3.11, a difference of 0.18%), and Czech (3.11, a difference of 0.18%). Similarly, the demographic groups most similar to Norwegians are German (3.09, a difference of 0.23%), Polish (3.09, a difference of 0.37%), Finnish (3.09, a difference of 0.42%), Croatian (3.10, a difference of 0.56%), and French (3.10, a difference of 0.57%).
| Demographics | Rating | Rank | Average Family Size |
| Soviet Union | 0.0 /100 | #323 | Tragic 3.11 |
| Celtics | 0.0 /100 | #324 | Tragic 3.11 |
| English | 0.0 /100 | #325 | Tragic 3.11 |
| Ottawa | 0.0 /100 | #326 | Tragic 3.11 |
| Dutch | 0.0 /100 | #327 | Tragic 3.11 |
| Czechs | 0.0 /100 | #328 | Tragic 3.11 |
| Belgians | 0.0 /100 | #329 | Tragic 3.11 |
| Latvians | 0.0 /100 | #330 | Tragic 3.11 |
| Scotch-Irish | 0.0 /100 | #331 | Tragic 3.11 |
| Scottish | 0.0 /100 | #332 | Tragic 3.11 |
| Estonians | 0.0 /100 | #333 | Tragic 3.10 |
| Lithuanians | 0.0 /100 | #334 | Tragic 3.10 |
| Luxembourgers | 0.0 /100 | #335 | Tragic 3.10 |
| Irish | 0.0 /100 | #336 | Tragic 3.10 |
| Swedes | 0.0 /100 | #337 | Tragic 3.10 |
| French | 0.0 /100 | #338 | Tragic 3.10 |
| Croatians | 0.0 /100 | #339 | Tragic 3.10 |
| Finns | 0.0 /100 | #340 | Tragic 3.09 |
| Poles | 0.0 /100 | #341 | Tragic 3.09 |
| Germans | 0.0 /100 | #342 | Tragic 3.09 |
| Norwegians | 0.0 /100 | #343 | Tragic 3.08 |