Nigerian vs Immigrants from Afghanistan Average Family Size
COMPARE
Nigerian
Immigrants from Afghanistan
Average Family Size
Average Family Size Comparison
Nigerians
Immigrants from Afghanistan
3.29
AVERAGE FAMILY SIZE
98.6/ 100
METRIC RATING
99th/ 347
METRIC RANK
3.32
AVERAGE FAMILY SIZE
99.8/ 100
METRIC RATING
83rd/ 347
METRIC RANK
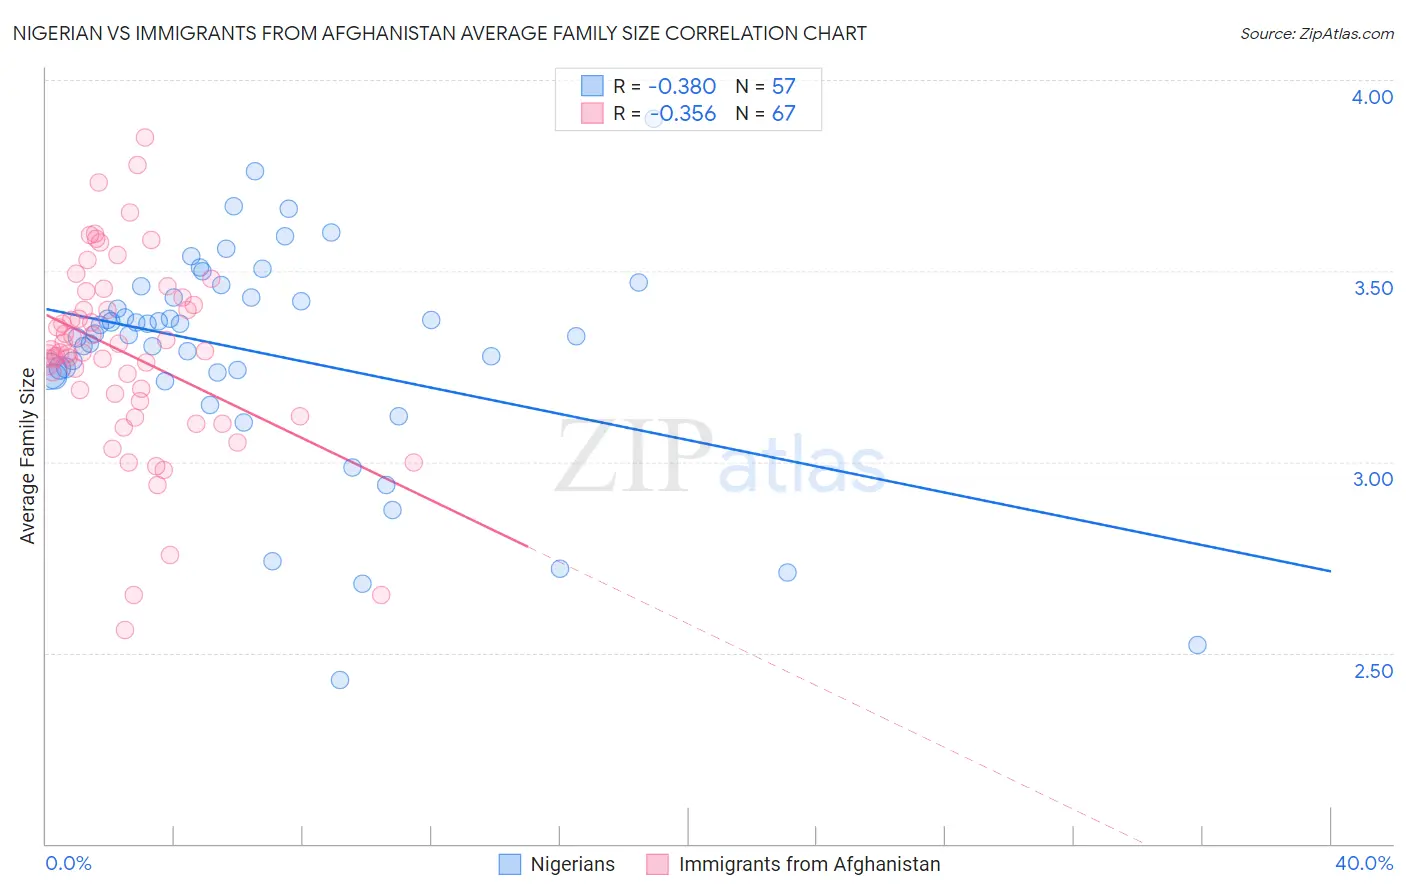
Nigerian vs Immigrants from Afghanistan Average Family Size Correlation Chart
The statistical analysis conducted on geographies consisting of 332,464,526 people shows a mild negative correlation between the proportion of Nigerians and average family size in the United States with a correlation coefficient (R) of -0.380 and weighted average of 3.29. Similarly, the statistical analysis conducted on geographies consisting of 147,621,409 people shows a mild negative correlation between the proportion of Immigrants from Afghanistan and average family size in the United States with a correlation coefficient (R) of -0.356 and weighted average of 3.32, a difference of 0.76%.
Average Family Size Correlation Summary
| Measurement | Nigerian | Immigrants from Afghanistan |
| Minimum | 2.43 | 2.56 |
| Maximum | 3.90 | 3.85 |
| Range | 1.47 | 1.29 |
| Mean | 3.28 | 3.28 |
| Median | 3.34 | 3.29 |
| Interquartile 25% (IQ1) | 3.23 | 3.16 |
| Interquartile 75% (IQ3) | 3.45 | 3.43 |
| Interquartile Range (IQR) | 0.22 | 0.27 |
| Standard Deviation (Sample) | 0.29 | 0.25 |
| Standard Deviation (Population) | 0.29 | 0.25 |
Demographics Similar to Nigerians and Immigrants from Afghanistan by Average Family Size
In terms of average family size, the demographic groups most similar to Nigerians are Barbadian (3.29, a difference of 0.0%), Immigrants from Oceania (3.29, a difference of 0.010%), Guamanian/Chamorro (3.29, a difference of 0.010%), Immigrants from Burma/Myanmar (3.29, a difference of 0.020%), and U.S. Virgin Islander (3.29, a difference of 0.050%). Similarly, the demographic groups most similar to Immigrants from Afghanistan are Ecuadorian (3.32, a difference of 0.010%), Immigrants from Nigeria (3.32, a difference of 0.030%), Immigrants from Dominica (3.32, a difference of 0.050%), Afghan (3.31, a difference of 0.080%), and Jamaican (3.31, a difference of 0.10%).
| Demographics | Rating | Rank | Average Family Size |
| Immigrants | Dominica | 99.8 /100 | #81 | Exceptional 3.32 |
| Ecuadorians | 99.8 /100 | #82 | Exceptional 3.32 |
| Immigrants | Afghanistan | 99.8 /100 | #83 | Exceptional 3.32 |
| Immigrants | Nigeria | 99.7 /100 | #84 | Exceptional 3.32 |
| Afghans | 99.7 /100 | #85 | Exceptional 3.31 |
| Jamaicans | 99.7 /100 | #86 | Exceptional 3.31 |
| Immigrants | Peru | 99.7 /100 | #87 | Exceptional 3.31 |
| Immigrants | Bolivia | 99.6 /100 | #88 | Exceptional 3.31 |
| Malaysians | 99.6 /100 | #89 | Exceptional 3.31 |
| Menominee | 99.4 /100 | #90 | Exceptional 3.30 |
| Immigrants | Pakistan | 99.2 /100 | #91 | Exceptional 3.30 |
| Immigrants | Cameroon | 99.2 /100 | #92 | Exceptional 3.30 |
| Peruvians | 99.2 /100 | #93 | Exceptional 3.30 |
| Sierra Leoneans | 99.0 /100 | #94 | Exceptional 3.30 |
| Immigrants | Lebanon | 99.0 /100 | #95 | Exceptional 3.30 |
| U.S. Virgin Islanders | 98.8 /100 | #96 | Exceptional 3.29 |
| Immigrants | Oceania | 98.7 /100 | #97 | Exceptional 3.29 |
| Barbadians | 98.6 /100 | #98 | Exceptional 3.29 |
| Nigerians | 98.6 /100 | #99 | Exceptional 3.29 |
| Guamanians/Chamorros | 98.6 /100 | #100 | Exceptional 3.29 |
| Immigrants | Burma/Myanmar | 98.6 /100 | #101 | Exceptional 3.29 |