Immigrants from Albania vs Norwegian Average Family Size
COMPARE
Immigrants from Albania
Norwegian
Average Family Size
Average Family Size Comparison
Immigrants from Albania
Norwegians
3.16
AVERAGE FAMILY SIZE
1.3/ 100
METRIC RATING
260th/ 347
METRIC RANK
3.08
AVERAGE FAMILY SIZE
0.0/ 100
METRIC RATING
343rd/ 347
METRIC RANK
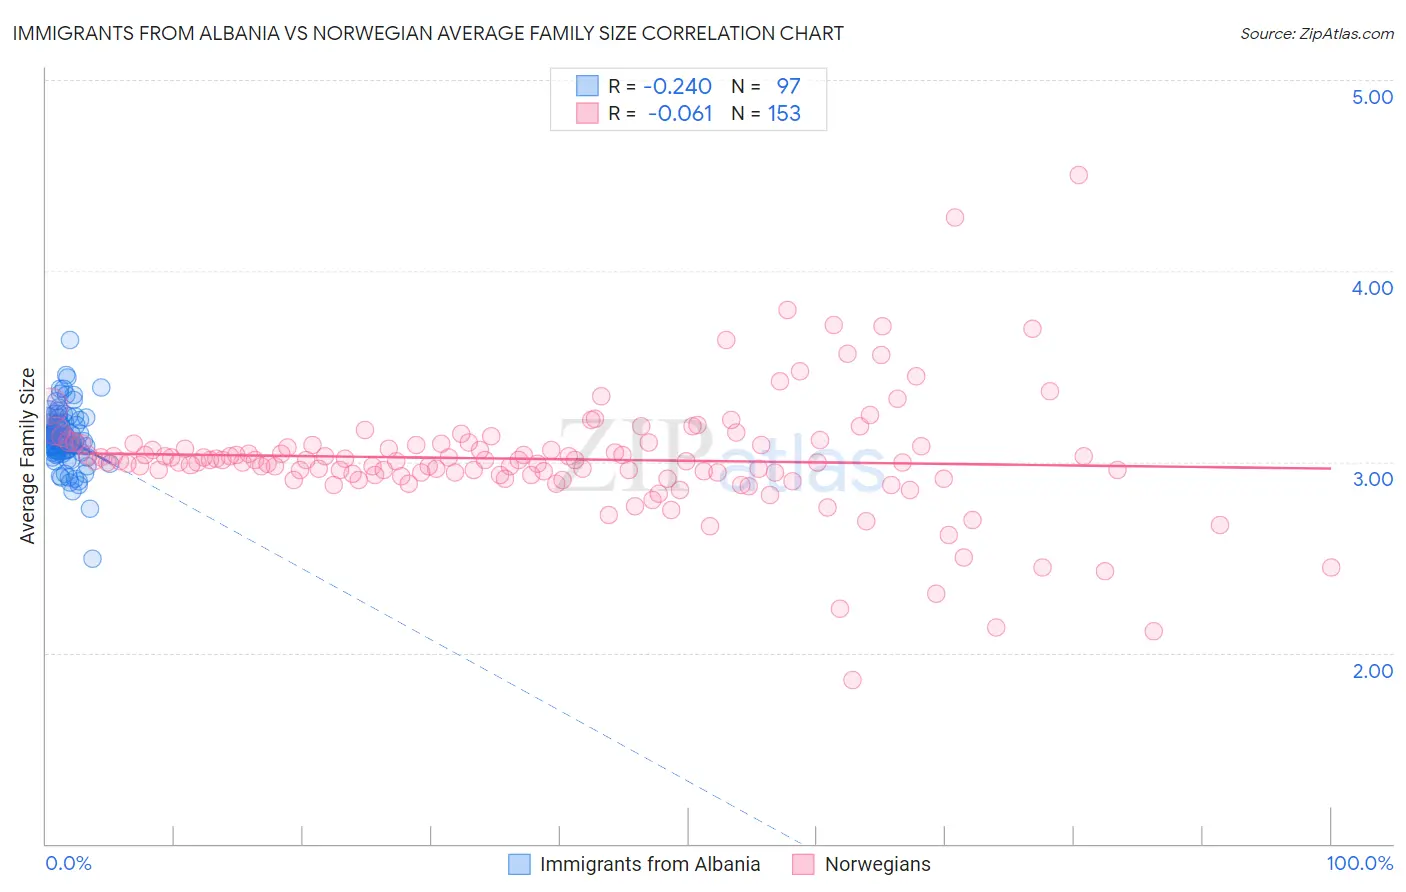
Immigrants from Albania vs Norwegian Average Family Size Correlation Chart
The statistical analysis conducted on geographies consisting of 119,382,596 people shows a weak negative correlation between the proportion of Immigrants from Albania and average family size in the United States with a correlation coefficient (R) of -0.240 and weighted average of 3.16. Similarly, the statistical analysis conducted on geographies consisting of 532,913,182 people shows a slight negative correlation between the proportion of Norwegians and average family size in the United States with a correlation coefficient (R) of -0.061 and weighted average of 3.08, a difference of 2.7%.
Average Family Size Correlation Summary
| Measurement | Immigrants from Albania | Norwegian |
| Minimum | 2.49 | 1.86 |
| Maximum | 3.64 | 4.50 |
| Range | 1.15 | 2.64 |
| Mean | 3.13 | 3.01 |
| Median | 3.13 | 3.00 |
| Interquartile 25% (IQ1) | 3.05 | 2.93 |
| Interquartile 75% (IQ3) | 3.21 | 3.09 |
| Interquartile Range (IQR) | 0.16 | 0.16 |
| Standard Deviation (Sample) | 0.16 | 0.31 |
| Standard Deviation (Population) | 0.16 | 0.31 |
Similar Demographics by Average Family Size
Demographics Similar to Immigrants from Albania by Average Family Size
In terms of average family size, the demographic groups most similar to Immigrants from Albania are Potawatomi (3.16, a difference of 0.0%), Turkish (3.16, a difference of 0.010%), Immigrants from North Macedonia (3.16, a difference of 0.010%), Immigrants from Russia (3.16, a difference of 0.010%), and Albanian (3.17, a difference of 0.060%).
| Demographics | Rating | Rank | Average Family Size |
| South Africans | 1.7 /100 | #253 | Tragic 3.17 |
| Immigrants | Hungary | 1.7 /100 | #254 | Tragic 3.17 |
| Cape Verdeans | 1.6 /100 | #255 | Tragic 3.17 |
| Immigrants | Kazakhstan | 1.5 /100 | #256 | Tragic 3.17 |
| Albanians | 1.5 /100 | #257 | Tragic 3.17 |
| Turks | 1.3 /100 | #258 | Tragic 3.16 |
| Potawatomi | 1.3 /100 | #259 | Tragic 3.16 |
| Immigrants | Albania | 1.3 /100 | #260 | Tragic 3.16 |
| Immigrants | North Macedonia | 1.3 /100 | #261 | Tragic 3.16 |
| Immigrants | Russia | 1.3 /100 | #262 | Tragic 3.16 |
| Immigrants | Bulgaria | 1.0 /100 | #263 | Tragic 3.16 |
| Americans | 1.0 /100 | #264 | Tragic 3.16 |
| Immigrants | South Africa | 0.9 /100 | #265 | Tragic 3.16 |
| Immigrants | Greece | 0.9 /100 | #266 | Tragic 3.16 |
| Iroquois | 0.8 /100 | #267 | Tragic 3.16 |
Demographics Similar to Norwegians by Average Family Size
In terms of average family size, the demographic groups most similar to Norwegians are German (3.09, a difference of 0.23%), French Canadian (3.07, a difference of 0.24%), Slovene (3.07, a difference of 0.28%), Polish (3.09, a difference of 0.37%), and Finnish (3.09, a difference of 0.42%).
| Demographics | Rating | Rank | Average Family Size |
| Estonians | 0.0 /100 | #333 | Tragic 3.10 |
| Lithuanians | 0.0 /100 | #334 | Tragic 3.10 |
| Luxembourgers | 0.0 /100 | #335 | Tragic 3.10 |
| Irish | 0.0 /100 | #336 | Tragic 3.10 |
| Swedes | 0.0 /100 | #337 | Tragic 3.10 |
| French | 0.0 /100 | #338 | Tragic 3.10 |
| Croatians | 0.0 /100 | #339 | Tragic 3.10 |
| Finns | 0.0 /100 | #340 | Tragic 3.09 |
| Poles | 0.0 /100 | #341 | Tragic 3.09 |
| Germans | 0.0 /100 | #342 | Tragic 3.09 |
| Norwegians | 0.0 /100 | #343 | Tragic 3.08 |
| French Canadians | 0.0 /100 | #344 | Tragic 3.07 |
| Slovenes | 0.0 /100 | #345 | Tragic 3.07 |
| Slovaks | 0.0 /100 | #346 | Tragic 3.06 |
| Carpatho Rusyns | 0.0 /100 | #347 | Tragic 3.06 |