Nigerian vs Sri Lankan Average Family Size
COMPARE
Nigerian
Sri Lankan
Average Family Size
Average Family Size Comparison
Nigerians
Sri Lankans
3.29
AVERAGE FAMILY SIZE
98.6/ 100
METRIC RATING
99th/ 347
METRIC RANK
3.35
AVERAGE FAMILY SIZE
100.0/ 100
METRIC RATING
57th/ 347
METRIC RANK
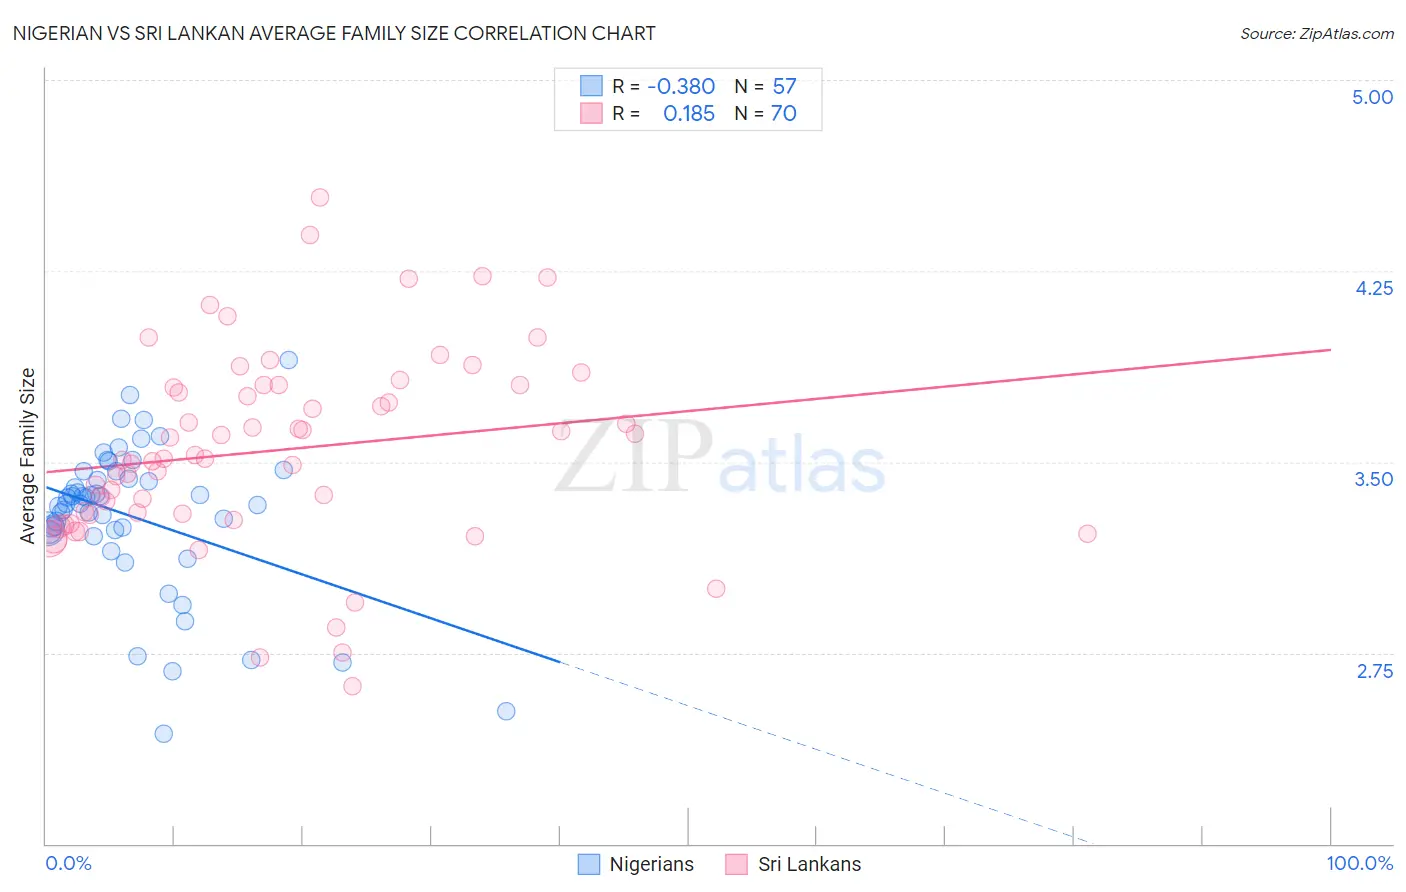
Nigerian vs Sri Lankan Average Family Size Correlation Chart
The statistical analysis conducted on geographies consisting of 332,464,526 people shows a mild negative correlation between the proportion of Nigerians and average family size in the United States with a correlation coefficient (R) of -0.380 and weighted average of 3.29. Similarly, the statistical analysis conducted on geographies consisting of 440,097,378 people shows a poor positive correlation between the proportion of Sri Lankans and average family size in the United States with a correlation coefficient (R) of 0.185 and weighted average of 3.35, a difference of 1.8%.
Average Family Size Correlation Summary
| Measurement | Nigerian | Sri Lankan |
| Minimum | 2.43 | 2.62 |
| Maximum | 3.90 | 4.54 |
| Range | 1.47 | 1.92 |
| Mean | 3.28 | 3.55 |
| Median | 3.34 | 3.51 |
| Interquartile 25% (IQ1) | 3.23 | 3.29 |
| Interquartile 75% (IQ3) | 3.45 | 3.80 |
| Interquartile Range (IQR) | 0.22 | 0.51 |
| Standard Deviation (Sample) | 0.29 | 0.38 |
| Standard Deviation (Population) | 0.29 | 0.38 |
Similar Demographics by Average Family Size
Demographics Similar to Nigerians by Average Family Size
In terms of average family size, the demographic groups most similar to Nigerians are Barbadian (3.29, a difference of 0.0%), Immigrants from Oceania (3.29, a difference of 0.010%), Guamanian/Chamorro (3.29, a difference of 0.010%), Immigrants from Burma/Myanmar (3.29, a difference of 0.020%), and West Indian (3.29, a difference of 0.030%).
| Demographics | Rating | Rank | Average Family Size |
| Immigrants | Cameroon | 99.2 /100 | #92 | Exceptional 3.30 |
| Peruvians | 99.2 /100 | #93 | Exceptional 3.30 |
| Sierra Leoneans | 99.0 /100 | #94 | Exceptional 3.30 |
| Immigrants | Lebanon | 99.0 /100 | #95 | Exceptional 3.30 |
| U.S. Virgin Islanders | 98.8 /100 | #96 | Exceptional 3.29 |
| Immigrants | Oceania | 98.7 /100 | #97 | Exceptional 3.29 |
| Barbadians | 98.6 /100 | #98 | Exceptional 3.29 |
| Nigerians | 98.6 /100 | #99 | Exceptional 3.29 |
| Guamanians/Chamorros | 98.6 /100 | #100 | Exceptional 3.29 |
| Immigrants | Burma/Myanmar | 98.6 /100 | #101 | Exceptional 3.29 |
| West Indians | 98.5 /100 | #102 | Exceptional 3.29 |
| Immigrants | Western Africa | 98.4 /100 | #103 | Exceptional 3.29 |
| Bolivians | 98.3 /100 | #104 | Exceptional 3.29 |
| Immigrants | Ghana | 98.1 /100 | #105 | Exceptional 3.29 |
| Paiute | 98.0 /100 | #106 | Exceptional 3.29 |
Demographics Similar to Sri Lankans by Average Family Size
In terms of average family size, the demographic groups most similar to Sri Lankans are Honduran (3.35, a difference of 0.010%), Immigrants from Dominican Republic (3.35, a difference of 0.060%), Japanese (3.35, a difference of 0.10%), Immigrants from Honduras (3.36, a difference of 0.12%), and Immigrants from Armenia (3.35, a difference of 0.12%).
| Demographics | Rating | Rank | Average Family Size |
| Immigrants | Bangladesh | 100.0 /100 | #50 | Exceptional 3.36 |
| Nicaraguans | 100.0 /100 | #51 | Exceptional 3.36 |
| Fijians | 100.0 /100 | #52 | Exceptional 3.36 |
| Koreans | 100.0 /100 | #53 | Exceptional 3.36 |
| Immigrants | South Eastern Asia | 100.0 /100 | #54 | Exceptional 3.36 |
| Immigrants | Honduras | 100.0 /100 | #55 | Exceptional 3.36 |
| Immigrants | Dominican Republic | 100.0 /100 | #56 | Exceptional 3.35 |
| Sri Lankans | 100.0 /100 | #57 | Exceptional 3.35 |
| Hondurans | 100.0 /100 | #58 | Exceptional 3.35 |
| Japanese | 100.0 /100 | #59 | Exceptional 3.35 |
| Immigrants | Armenia | 100.0 /100 | #60 | Exceptional 3.35 |
| Central American Indians | 100.0 /100 | #61 | Exceptional 3.35 |
| Immigrants | Grenada | 100.0 /100 | #62 | Exceptional 3.34 |
| Chinese | 100.0 /100 | #63 | Exceptional 3.34 |
| Dominicans | 99.9 /100 | #64 | Exceptional 3.34 |