Immigrants from Kazakhstan vs Tlingit-Haida Currently Married
COMPARE
Immigrants from Kazakhstan
Tlingit-Haida
Currently Married
Currently Married Comparison
Immigrants from Kazakhstan
Tlingit-Haida
47.4%
CURRENTLY MARRIED
87.2/ 100
METRIC RATING
123rd/ 347
METRIC RANK
46.7%
CURRENTLY MARRIED
51.2/ 100
METRIC RATING
173rd/ 347
METRIC RANK
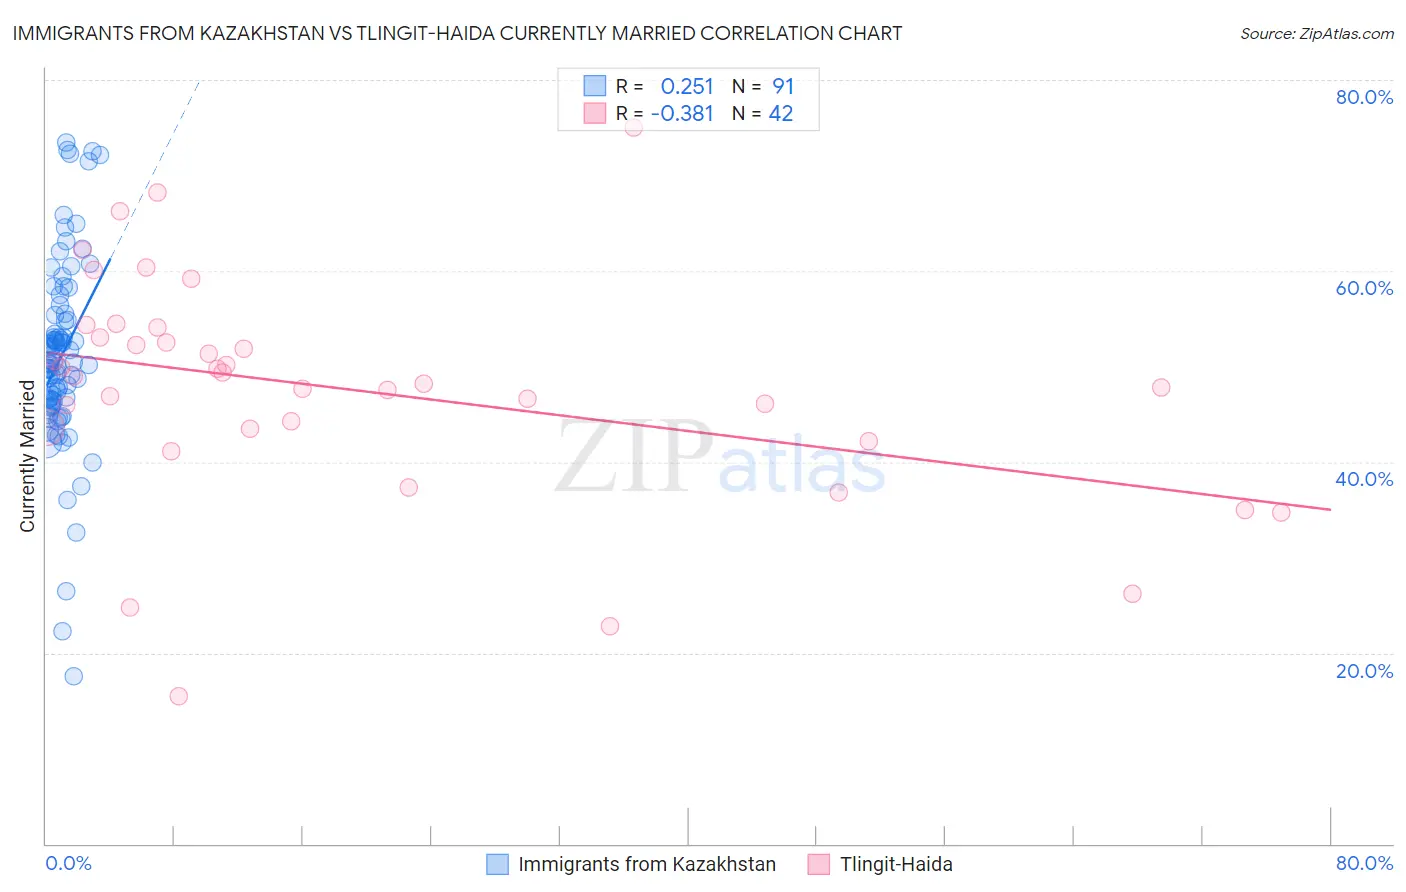
Immigrants from Kazakhstan vs Tlingit-Haida Currently Married Correlation Chart
The statistical analysis conducted on geographies consisting of 124,441,390 people shows a weak positive correlation between the proportion of Immigrants from Kazakhstan and percentage of population currently married in the United States with a correlation coefficient (R) of 0.251 and weighted average of 47.4%. Similarly, the statistical analysis conducted on geographies consisting of 60,872,339 people shows a mild negative correlation between the proportion of Tlingit-Haida and percentage of population currently married in the United States with a correlation coefficient (R) of -0.381 and weighted average of 46.7%, a difference of 1.7%.
Currently Married Correlation Summary
| Measurement | Immigrants from Kazakhstan | Tlingit-Haida |
| Minimum | 17.6% | 15.4% |
| Maximum | 73.4% | 75.0% |
| Range | 55.8% | 59.6% |
| Mean | 51.1% | 47.6% |
| Median | 50.3% | 48.6% |
| Interquartile 25% (IQ1) | 46.3% | 43.5% |
| Interquartile 75% (IQ3) | 55.4% | 53.1% |
| Interquartile Range (IQR) | 9.1% | 9.6% |
| Standard Deviation (Sample) | 9.9% | 11.9% |
| Standard Deviation (Population) | 9.8% | 11.7% |
Similar Demographics by Currently Married
Demographics Similar to Immigrants from Kazakhstan by Currently Married
In terms of currently married, the demographic groups most similar to Immigrants from Kazakhstan are Laotian (47.4%, a difference of 0.050%), Osage (47.5%, a difference of 0.060%), Immigrants from Croatia (47.5%, a difference of 0.12%), Syrian (47.5%, a difference of 0.15%), and Okinawan (47.4%, a difference of 0.15%).
| Demographics | Rating | Rank | Currently Married |
| Palestinians | 90.4 /100 | #116 | Exceptional 47.6% |
| Puget Sound Salish | 90.3 /100 | #117 | Exceptional 47.6% |
| Immigrants | Philippines | 90.2 /100 | #118 | Exceptional 47.6% |
| Australians | 90.2 /100 | #119 | Exceptional 47.6% |
| Syrians | 88.9 /100 | #120 | Excellent 47.5% |
| Immigrants | Croatia | 88.6 /100 | #121 | Excellent 47.5% |
| Osage | 87.9 /100 | #122 | Excellent 47.5% |
| Immigrants | Kazakhstan | 87.2 /100 | #123 | Excellent 47.4% |
| Laotians | 86.6 /100 | #124 | Excellent 47.4% |
| Okinawans | 85.3 /100 | #125 | Excellent 47.4% |
| Immigrants | Jordan | 84.9 /100 | #126 | Excellent 47.4% |
| New Zealanders | 84.9 /100 | #127 | Excellent 47.4% |
| Portuguese | 84.2 /100 | #128 | Excellent 47.3% |
| Sri Lankans | 83.2 /100 | #129 | Excellent 47.3% |
| Immigrants | Iraq | 82.8 /100 | #130 | Excellent 47.3% |
Demographics Similar to Tlingit-Haida by Currently Married
In terms of currently married, the demographic groups most similar to Tlingit-Haida are Aleut (46.7%, a difference of 0.030%), Peruvian (46.6%, a difference of 0.040%), Immigrants from Zimbabwe (46.7%, a difference of 0.050%), Immigrants from Brazil (46.6%, a difference of 0.050%), and Hawaiian (46.6%, a difference of 0.090%).
| Demographics | Rating | Rank | Currently Married |
| Immigrants | Syria | 59.3 /100 | #166 | Average 46.8% |
| Spaniards | 58.8 /100 | #167 | Average 46.8% |
| Immigrants | Afghanistan | 58.2 /100 | #168 | Average 46.8% |
| Armenians | 58.2 /100 | #169 | Average 46.8% |
| Immigrants | Latvia | 56.7 /100 | #170 | Average 46.7% |
| Immigrants | Zimbabwe | 52.4 /100 | #171 | Average 46.7% |
| Aleuts | 52.0 /100 | #172 | Average 46.7% |
| Tlingit-Haida | 51.2 /100 | #173 | Average 46.7% |
| Peruvians | 50.0 /100 | #174 | Average 46.6% |
| Immigrants | Brazil | 49.9 /100 | #175 | Average 46.6% |
| Hawaiians | 48.6 /100 | #176 | Average 46.6% |
| Israelis | 48.6 /100 | #177 | Average 46.6% |
| Chickasaw | 47.8 /100 | #178 | Average 46.6% |
| Immigrants | Oceania | 44.6 /100 | #179 | Average 46.5% |
| Costa Ricans | 43.7 /100 | #180 | Average 46.5% |