Nicaraguan vs Tlingit-Haida Associate's Degree
COMPARE
Nicaraguan
Tlingit-Haida
Associate's Degree
Associate's Degree Comparison
Nicaraguans
Tlingit-Haida
41.5%
ASSOCIATE'S DEGREE
0.4/ 100
METRIC RATING
261st/ 347
METRIC RANK
43.0%
ASSOCIATE'S DEGREE
2.1/ 100
METRIC RATING
234th/ 347
METRIC RANK
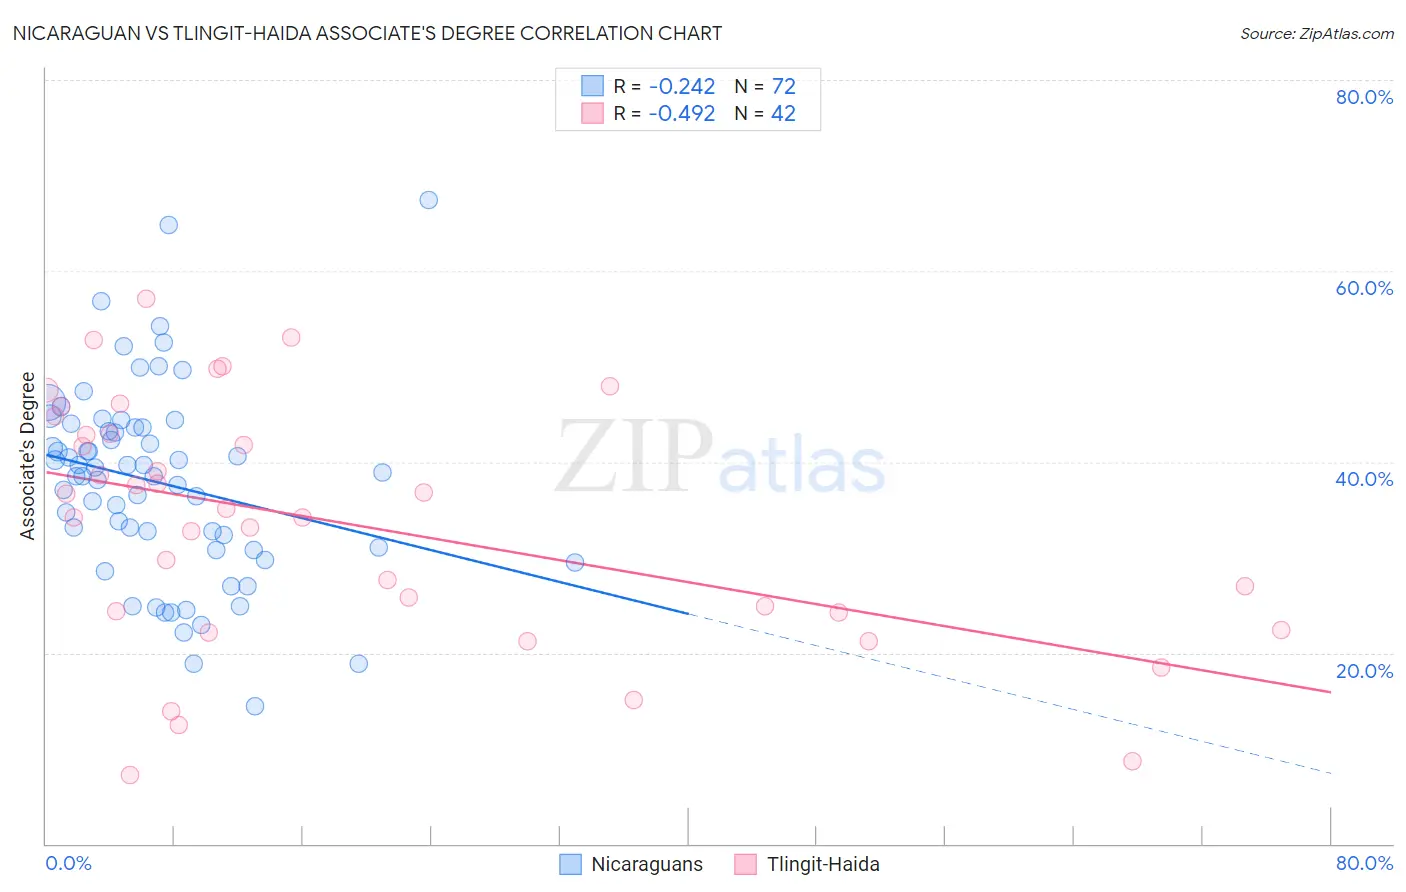
Nicaraguan vs Tlingit-Haida Associate's Degree Correlation Chart
The statistical analysis conducted on geographies consisting of 285,707,386 people shows a weak negative correlation between the proportion of Nicaraguans and percentage of population with at least associate's degree education in the United States with a correlation coefficient (R) of -0.242 and weighted average of 41.5%. Similarly, the statistical analysis conducted on geographies consisting of 60,872,339 people shows a moderate negative correlation between the proportion of Tlingit-Haida and percentage of population with at least associate's degree education in the United States with a correlation coefficient (R) of -0.492 and weighted average of 43.0%, a difference of 3.6%.
Associate's Degree Correlation Summary
| Measurement | Nicaraguan | Tlingit-Haida |
| Minimum | 14.4% | 7.1% |
| Maximum | 67.4% | 57.1% |
| Range | 53.0% | 50.0% |
| Mean | 37.8% | 33.5% |
| Median | 38.7% | 34.6% |
| Interquartile 25% (IQ1) | 30.9% | 24.2% |
| Interquartile 75% (IQ3) | 43.6% | 43.0% |
| Interquartile Range (IQR) | 12.7% | 18.8% |
| Standard Deviation (Sample) | 10.2% | 12.9% |
| Standard Deviation (Population) | 10.1% | 12.7% |
Similar Demographics by Associate's Degree
Demographics Similar to Nicaraguans by Associate's Degree
In terms of associate's degree, the demographic groups most similar to Nicaraguans are Bahamian (41.5%, a difference of 0.090%), Immigrants from Jamaica (41.5%, a difference of 0.11%), Osage (41.5%, a difference of 0.12%), Marshallese (41.6%, a difference of 0.13%), and Malaysian (41.6%, a difference of 0.32%).
| Demographics | Rating | Rank | Associate's Degree |
| Cubans | 0.6 /100 | #254 | Tragic 41.9% |
| Immigrants | Guyana | 0.5 /100 | #255 | Tragic 41.8% |
| Immigrants | Congo | 0.5 /100 | #256 | Tragic 41.8% |
| Spanish Americans | 0.5 /100 | #257 | Tragic 41.8% |
| Japanese | 0.5 /100 | #258 | Tragic 41.7% |
| Malaysians | 0.4 /100 | #259 | Tragic 41.6% |
| Marshallese | 0.4 /100 | #260 | Tragic 41.6% |
| Nicaraguans | 0.4 /100 | #261 | Tragic 41.5% |
| Bahamians | 0.4 /100 | #262 | Tragic 41.5% |
| Immigrants | Jamaica | 0.3 /100 | #263 | Tragic 41.5% |
| Osage | 0.3 /100 | #264 | Tragic 41.5% |
| Africans | 0.2 /100 | #265 | Tragic 41.1% |
| Samoans | 0.2 /100 | #266 | Tragic 41.1% |
| Hawaiians | 0.2 /100 | #267 | Tragic 40.9% |
| Central American Indians | 0.2 /100 | #268 | Tragic 40.8% |
Demographics Similar to Tlingit-Haida by Associate's Degree
In terms of associate's degree, the demographic groups most similar to Tlingit-Haida are Tongan (43.0%, a difference of 0.090%), Ecuadorian (43.0%, a difference of 0.090%), Immigrants from St. Vincent and the Grenadines (42.9%, a difference of 0.18%), Nonimmigrants (42.9%, a difference of 0.20%), and Native Hawaiian (43.1%, a difference of 0.25%).
| Demographics | Rating | Rank | Associate's Degree |
| Trinidadians and Tobagonians | 4.0 /100 | #227 | Tragic 43.6% |
| Hmong | 3.2 /100 | #228 | Tragic 43.4% |
| Immigrants | Trinidad and Tobago | 3.0 /100 | #229 | Tragic 43.3% |
| Immigrants | Barbados | 2.9 /100 | #230 | Tragic 43.3% |
| Liberians | 2.9 /100 | #231 | Tragic 43.3% |
| Native Hawaiians | 2.3 /100 | #232 | Tragic 43.1% |
| Tongans | 2.2 /100 | #233 | Tragic 43.0% |
| Tlingit-Haida | 2.1 /100 | #234 | Tragic 43.0% |
| Ecuadorians | 2.0 /100 | #235 | Tragic 43.0% |
| Immigrants | St. Vincent and the Grenadines | 1.9 /100 | #236 | Tragic 42.9% |
| Immigrants | Nonimmigrants | 1.9 /100 | #237 | Tragic 42.9% |
| Iroquois | 1.7 /100 | #238 | Tragic 42.8% |
| Immigrants | Grenada | 1.3 /100 | #239 | Tragic 42.6% |
| Cree | 1.2 /100 | #240 | Tragic 42.5% |
| British West Indians | 1.0 /100 | #241 | Tragic 42.4% |