Nepalese vs Immigrants from Denmark Single Father Households
COMPARE
Nepalese
Immigrants from Denmark
Single Father Households
Single Father Households Comparison
Nepalese
Immigrants from Denmark
3.1%
SINGLE FATHER HOUSEHOLDS
0.0/ 100
METRIC RATING
330th/ 347
METRIC RANK
2.1%
SINGLE FATHER HOUSEHOLDS
99.8/ 100
METRIC RATING
68th/ 347
METRIC RANK
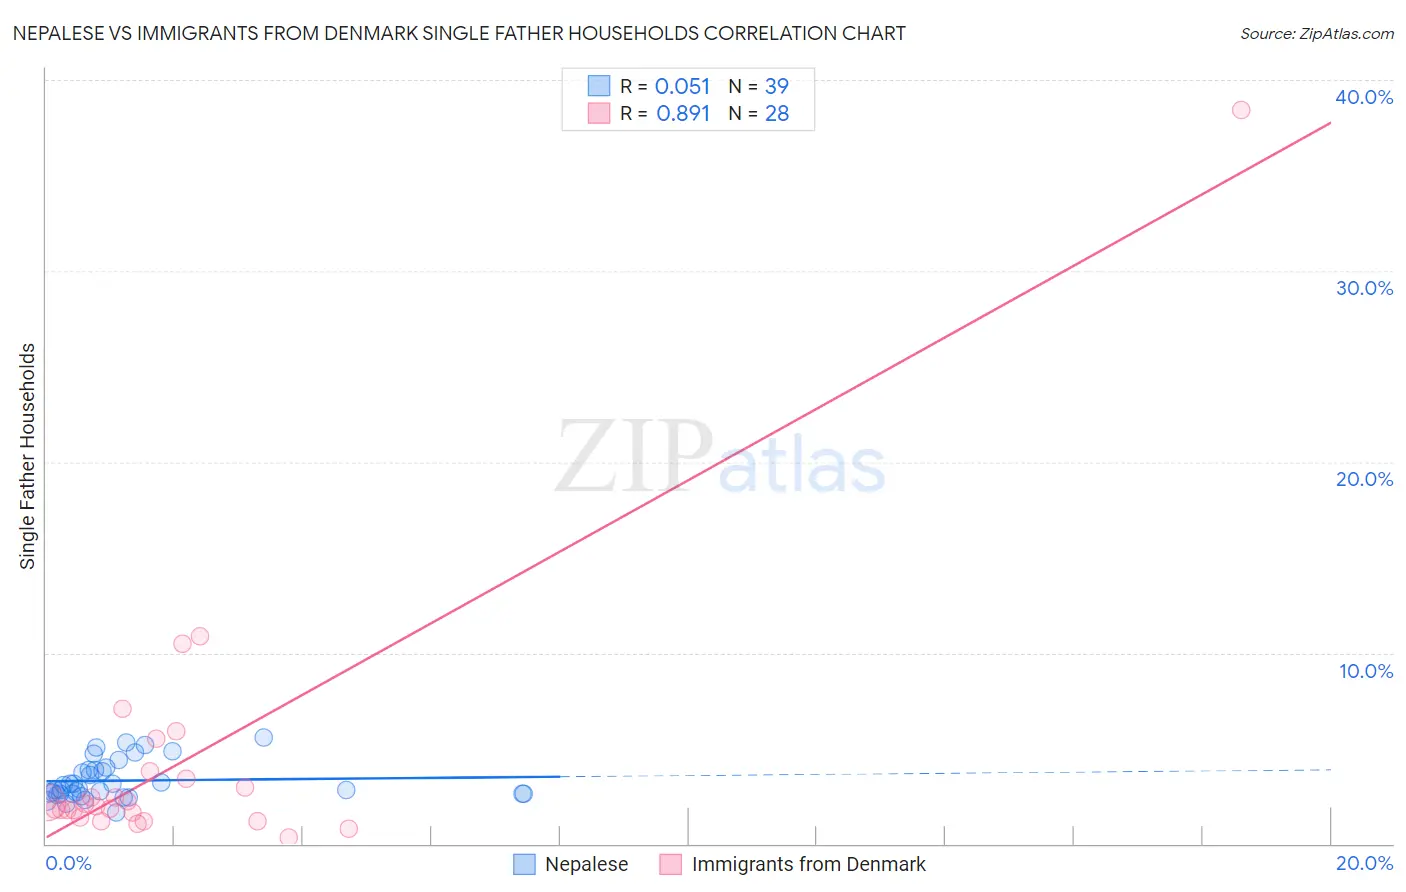
Nepalese vs Immigrants from Denmark Single Father Households Correlation Chart
The statistical analysis conducted on geographies consisting of 24,491,034 people shows a slight positive correlation between the proportion of Nepalese and percentage of single father households in the United States with a correlation coefficient (R) of 0.051 and weighted average of 3.1%. Similarly, the statistical analysis conducted on geographies consisting of 135,813,845 people shows a very strong positive correlation between the proportion of Immigrants from Denmark and percentage of single father households in the United States with a correlation coefficient (R) of 0.891 and weighted average of 2.1%, a difference of 51.2%.
Single Father Households Correlation Summary
| Measurement | Nepalese | Immigrants from Denmark |
| Minimum | 1.6% | 0.35% |
| Maximum | 5.6% | 38.5% |
| Range | 4.0% | 38.1% |
| Mean | 3.3% | 4.3% |
| Median | 2.9% | 2.0% |
| Interquartile 25% (IQ1) | 2.6% | 1.5% |
| Interquartile 75% (IQ3) | 3.9% | 3.6% |
| Interquartile Range (IQR) | 1.3% | 2.1% |
| Standard Deviation (Sample) | 1.0% | 7.2% |
| Standard Deviation (Population) | 0.99% | 7.1% |
Similar Demographics by Single Father Households
Demographics Similar to Nepalese by Single Father Households
In terms of single father households, the demographic groups most similar to Nepalese are Chippewa (3.1%, a difference of 0.88%), Immigrants from Cabo Verde (3.1%, a difference of 0.98%), Bangladeshi (3.1%, a difference of 1.5%), Navajo (3.2%, a difference of 2.3%), and Yaqui (3.2%, a difference of 2.3%).
| Demographics | Rating | Rank | Single Father Households |
| Immigrants | Central America | 0.0 /100 | #323 | Tragic 3.0% |
| Fijians | 0.0 /100 | #324 | Tragic 3.0% |
| Immigrants | Mexico | 0.0 /100 | #325 | Tragic 3.0% |
| Aleuts | 0.0 /100 | #326 | Tragic 3.0% |
| Bangladeshis | 0.0 /100 | #327 | Tragic 3.1% |
| Immigrants | Cabo Verde | 0.0 /100 | #328 | Tragic 3.1% |
| Chippewa | 0.0 /100 | #329 | Tragic 3.1% |
| Nepalese | 0.0 /100 | #330 | Tragic 3.1% |
| Navajo | 0.0 /100 | #331 | Tragic 3.2% |
| Yaqui | 0.0 /100 | #332 | Tragic 3.2% |
| Natives/Alaskans | 0.0 /100 | #333 | Tragic 3.2% |
| Yuman | 0.0 /100 | #334 | Tragic 3.3% |
| Colville | 0.0 /100 | #335 | Tragic 3.3% |
| Paiute | 0.0 /100 | #336 | Tragic 3.3% |
| Pueblo | 0.0 /100 | #337 | Tragic 3.3% |
Demographics Similar to Immigrants from Denmark by Single Father Households
In terms of single father households, the demographic groups most similar to Immigrants from Denmark are Immigrants from Romania (2.1%, a difference of 0.020%), Immigrants from Italy (2.1%, a difference of 0.090%), Immigrants from Western Asia (2.1%, a difference of 0.14%), Egyptian (2.1%, a difference of 0.23%), and Immigrants from Kuwait (2.1%, a difference of 0.24%).
| Demographics | Rating | Rank | Single Father Households |
| Vietnamese | 99.9 /100 | #61 | Exceptional 2.0% |
| Immigrants | Malaysia | 99.9 /100 | #62 | Exceptional 2.0% |
| Maltese | 99.9 /100 | #63 | Exceptional 2.0% |
| Mongolians | 99.9 /100 | #64 | Exceptional 2.1% |
| Paraguayans | 99.9 /100 | #65 | Exceptional 2.1% |
| Immigrants | Western Asia | 99.8 /100 | #66 | Exceptional 2.1% |
| Immigrants | Italy | 99.8 /100 | #67 | Exceptional 2.1% |
| Immigrants | Denmark | 99.8 /100 | #68 | Exceptional 2.1% |
| Immigrants | Romania | 99.8 /100 | #69 | Exceptional 2.1% |
| Egyptians | 99.8 /100 | #70 | Exceptional 2.1% |
| Immigrants | Kuwait | 99.8 /100 | #71 | Exceptional 2.1% |
| Immigrants | Spain | 99.8 /100 | #72 | Exceptional 2.1% |
| Immigrants | Bangladesh | 99.8 /100 | #73 | Exceptional 2.1% |
| Immigrants | Egypt | 99.8 /100 | #74 | Exceptional 2.1% |
| Immigrants | Sweden | 99.8 /100 | #75 | Exceptional 2.1% |