Nepalese vs Immigrants from China Single Father Households
COMPARE
Nepalese
Immigrants from China
Single Father Households
Single Father Households Comparison
Nepalese
Immigrants from China
3.1%
SINGLE FATHER HOUSEHOLDS
0.0/ 100
METRIC RATING
330th/ 347
METRIC RANK
1.8%
SINGLE FATHER HOUSEHOLDS
100.0/ 100
METRIC RATING
9th/ 347
METRIC RANK
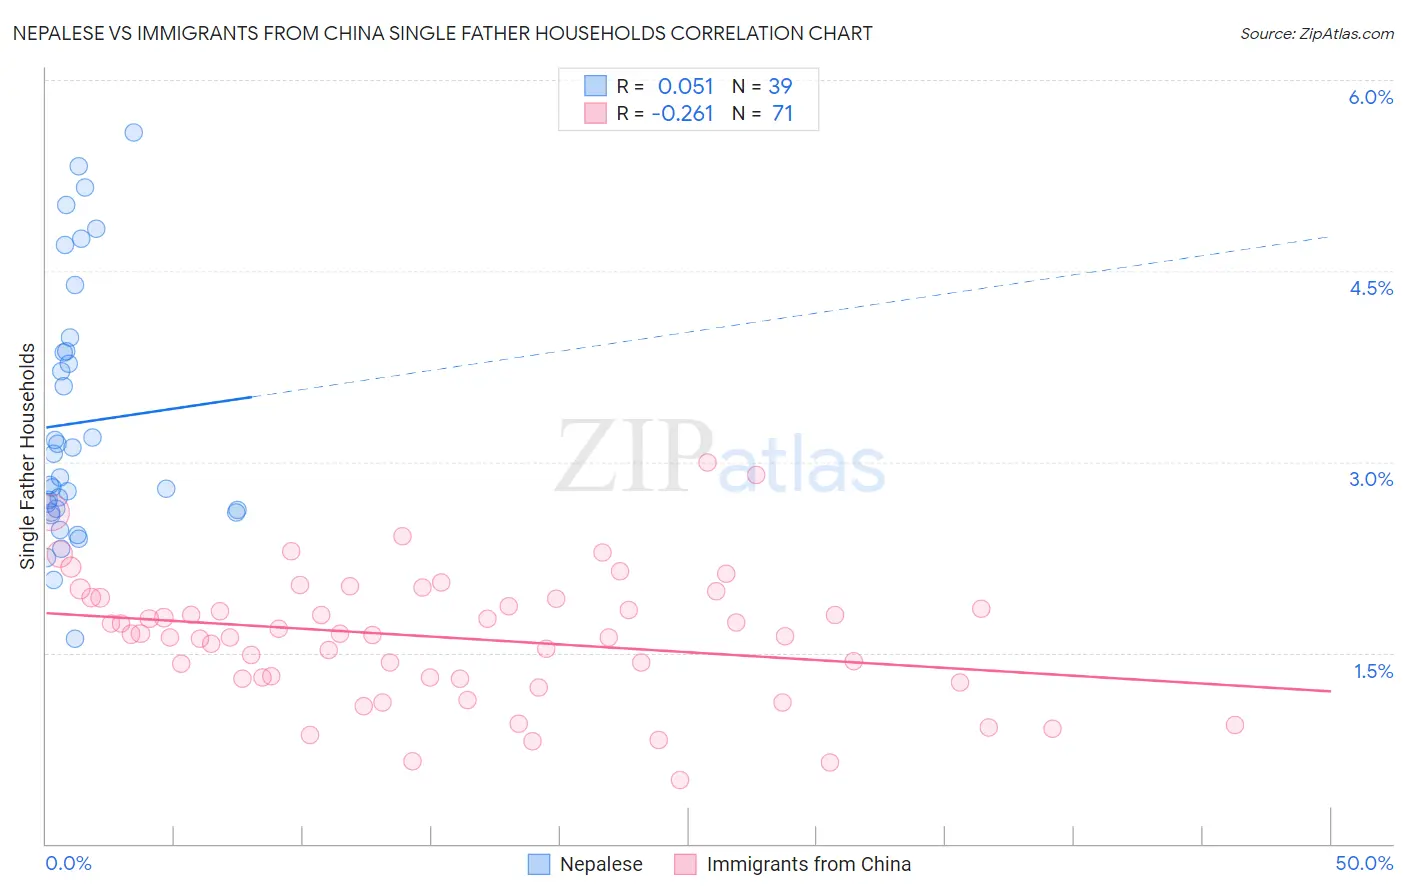
Nepalese vs Immigrants from China Single Father Households Correlation Chart
The statistical analysis conducted on geographies consisting of 24,491,034 people shows a slight positive correlation between the proportion of Nepalese and percentage of single father households in the United States with a correlation coefficient (R) of 0.051 and weighted average of 3.1%. Similarly, the statistical analysis conducted on geographies consisting of 451,618,503 people shows a weak negative correlation between the proportion of Immigrants from China and percentage of single father households in the United States with a correlation coefficient (R) of -0.261 and weighted average of 1.8%, a difference of 68.9%.
Single Father Households Correlation Summary
| Measurement | Nepalese | Immigrants from China |
| Minimum | 1.6% | 0.50% |
| Maximum | 5.6% | 3.0% |
| Range | 4.0% | 2.5% |
| Mean | 3.3% | 1.6% |
| Median | 2.9% | 1.6% |
| Interquartile 25% (IQ1) | 2.6% | 1.3% |
| Interquartile 75% (IQ3) | 3.9% | 1.9% |
| Interquartile Range (IQR) | 1.3% | 0.63% |
| Standard Deviation (Sample) | 1.0% | 0.51% |
| Standard Deviation (Population) | 0.99% | 0.50% |
Similar Demographics by Single Father Households
Demographics Similar to Nepalese by Single Father Households
In terms of single father households, the demographic groups most similar to Nepalese are Chippewa (3.1%, a difference of 0.88%), Immigrants from Cabo Verde (3.1%, a difference of 0.98%), Bangladeshi (3.1%, a difference of 1.5%), Navajo (3.2%, a difference of 2.3%), and Yaqui (3.2%, a difference of 2.3%).
| Demographics | Rating | Rank | Single Father Households |
| Immigrants | Central America | 0.0 /100 | #323 | Tragic 3.0% |
| Fijians | 0.0 /100 | #324 | Tragic 3.0% |
| Immigrants | Mexico | 0.0 /100 | #325 | Tragic 3.0% |
| Aleuts | 0.0 /100 | #326 | Tragic 3.0% |
| Bangladeshis | 0.0 /100 | #327 | Tragic 3.1% |
| Immigrants | Cabo Verde | 0.0 /100 | #328 | Tragic 3.1% |
| Chippewa | 0.0 /100 | #329 | Tragic 3.1% |
| Nepalese | 0.0 /100 | #330 | Tragic 3.1% |
| Navajo | 0.0 /100 | #331 | Tragic 3.2% |
| Yaqui | 0.0 /100 | #332 | Tragic 3.2% |
| Natives/Alaskans | 0.0 /100 | #333 | Tragic 3.2% |
| Yuman | 0.0 /100 | #334 | Tragic 3.3% |
| Colville | 0.0 /100 | #335 | Tragic 3.3% |
| Paiute | 0.0 /100 | #336 | Tragic 3.3% |
| Pueblo | 0.0 /100 | #337 | Tragic 3.3% |
Demographics Similar to Immigrants from China by Single Father Households
In terms of single father households, the demographic groups most similar to Immigrants from China are Immigrants from Ireland (1.8%, a difference of 0.14%), Cypriot (1.8%, a difference of 0.25%), Okinawan (1.9%, a difference of 0.36%), Immigrants from Taiwan (1.8%, a difference of 0.40%), and Immigrants from Belarus (1.9%, a difference of 0.68%).
| Demographics | Rating | Rank | Single Father Households |
| Immigrants | Israel | 100.0 /100 | #2 | Exceptional 1.8% |
| Filipinos | 100.0 /100 | #3 | Exceptional 1.8% |
| Immigrants | Uzbekistan | 100.0 /100 | #4 | Exceptional 1.8% |
| Immigrants | Hong Kong | 100.0 /100 | #5 | Exceptional 1.8% |
| Immigrants | Taiwan | 100.0 /100 | #6 | Exceptional 1.8% |
| Cypriots | 100.0 /100 | #7 | Exceptional 1.8% |
| Immigrants | Ireland | 100.0 /100 | #8 | Exceptional 1.8% |
| Immigrants | China | 100.0 /100 | #9 | Exceptional 1.8% |
| Okinawans | 100.0 /100 | #10 | Exceptional 1.9% |
| Immigrants | Belarus | 100.0 /100 | #11 | Exceptional 1.9% |
| Immigrants | Greece | 100.0 /100 | #12 | Exceptional 1.9% |
| Immigrants | Singapore | 100.0 /100 | #13 | Exceptional 1.9% |
| Immigrants | Lithuania | 100.0 /100 | #14 | Exceptional 1.9% |
| Immigrants | Eastern Asia | 100.0 /100 | #15 | Exceptional 1.9% |
| Immigrants | Iran | 100.0 /100 | #16 | Exceptional 1.9% |