Nepalese vs Bhutanese Single Father Households

COMPARE

Nepalese
Race
Ancestry
AfghanAfricanAlaska NativeAlaskan AthabascanAlbanianAleutAlsatianAmericanApacheArabArapahoArgentineanArmenianAssyrian/Chaldean/SyriacAustralianAustrianBahamianBangladeshiBarbadianBasqueBelgianBelizeanBermudanBlackfeetBolivianBrazilianBritishBritish West IndianBulgarianBurmeseCajunCambodianCanadianCape VerdeanCarpatho RusynCelticCentral AmericanCentral American IndianCherokeeCheyenneChickasawChileanChineseChippewaChoctawColombianColvilleComancheCosta RicanCreeCreekCroatianCrowCubanCypriotCzechCzechoslovakianDanishDelawareDominicanDutchDutch West IndianEastern EuropeanEcuadorianEgyptianEnglishEstonianEthiopianEuropeanFijianFilipinoFinnishFrenchFrench American IndianFrench CanadianGermanGerman RussianGhanaianGreekGuamanian/ChamorroGuatemalanGuyaneseHaitianHmongHonduranHopiHoumaHungarianIcelanderIndian (Asian)IndonesianInupiatIranianIraqiIrishIroquoisIsraeliItalianJamaicanJapaneseJordanianKenyanKiowaKoreanLaotianLatvianLebaneseLiberianLithuanianLumbeeLuxembourgerMacedonianMalaysianMalteseMarshalleseMenomineeMexicanMexican American IndianMongolianMoroccanNative HawaiianNavajoNepaleseNew ZealanderNicaraguanNigerianNorthern EuropeanNorwegianOkinawanOsageOttawaPaiutePakistaniPalestinianPanamanianParaguayanPennsylvania GermanPeruvianPimaPolishPortuguesePotawatomiPuebloPuerto RicanPuget Sound SalishRomanianRussianSalvadoranSamoanScandinavianScotch-IrishScottishSeminoleSenegaleseSerbianShoshoneSierra LeoneanSiouxSlavicSlovakSloveneSomaliSouth AfricanSouth AmericanSouth American IndianSoviet UnionSpaniardSpanishSpanish AmericanSpanish American IndianSri LankanSubsaharan AfricanSudaneseSwedishSwissSyrianTaiwaneseThaiTlingit-HaidaTohono O'OdhamTonganTrinidadian and TobagonianTsimshianTurkishU.S. Virgin IslanderUgandanUkrainianUruguayanUteVenezuelanVietnameseWelshWest IndianYakamaYaquiYugoslavianYumanYup'ikZimbabwean
Immigration
NonimmigrantsImmigrantsAfghanistanAfricaAlbaniaArgentinaArmeniaAsiaAustraliaAustriaBahamasBangladeshBarbadosBelarusBelgiumBelizeBoliviaBosnia and HerzegovinaBrazilBulgariaBurma/MyanmarCabo VerdeCambodiaCameroonCanadaCaribbeanCentral AmericaChileChinaColombiaCongoCosta RicaCroatiaCubaCzechoslovakiaDenmarkDominicaDominican RepublicEastern AfricaEastern AsiaEastern EuropeEcuadorEgyptEl SalvadorEnglandEritreaEthiopiaEuropeFijiFranceGermanyGhanaGreeceGrenadaGuatemalaGuyanaHaitiHondurasHong KongHungaryIndiaIndonesiaIranIraqIrelandIsraelItalyJamaicaJapanJordanKazakhstanKenyaKoreaKuwaitLaosLatin AmericaLatviaLebanonLiberiaLithuaniaMalaysiaMexicoMicronesiaMiddle AfricaMoldovaMoroccoNepalNetherlandsNicaraguaNigeriaNorth AmericaNorth MacedoniaNorthern AfricaNorthern EuropeNorwayOceaniaPakistanPanamaPeruPhilippinesPolandPortugalRomaniaRussiaSaudi ArabiaScotlandSenegalSerbiaSierra LeoneSingaporeSomaliaSouth AfricaSouth AmericaSouth Central AsiaSouth Eastern AsiaSouthern EuropeSpainSri LankaSt. Vincent and the GrenadinesSudanSwedenSwitzerlandSyriaTaiwanThailandTrinidad and TobagoTurkeyUgandaUkraineUruguayUzbekistanVenezuelaVietnamWest IndiesWestern AfricaWestern AsiaWestern EuropeYemenZaireZimbabweAzores
Bhutanese
Race
Ancestry
AfghanAfricanAlaska NativeAlaskan AthabascanAlbanianAleutAlsatianAmericanApacheArabArapahoArgentineanArmenianAssyrian/Chaldean/SyriacAustralianAustrianBahamianBangladeshiBarbadianBasqueBelgianBelizeanBermudanBhutaneseBlackfeetBolivianBrazilianBritishBritish West IndianBulgarianBurmeseCajunCambodianCanadianCape VerdeanCarpatho RusynCelticCentral AmericanCentral American IndianCherokeeCheyenneChickasawChileanChineseChippewaChoctawColombianColvilleComancheCosta RicanCreeCreekCroatianCrowCubanCypriotCzechCzechoslovakianDanishDelawareDominicanDutchDutch West IndianEastern EuropeanEcuadorianEgyptianEnglishEstonianEthiopianEuropeanFijianFilipinoFinnishFrenchFrench American IndianFrench CanadianGermanGerman RussianGhanaianGreekGuamanian/ChamorroGuatemalanGuyaneseHaitianHmongHonduranHopiHoumaHungarianIcelanderIndian (Asian)IndonesianInupiatIranianIraqiIrishIroquoisIsraeliItalianJamaicanJapaneseJordanianKenyanKiowaKoreanLaotianLatvianLebaneseLiberianLithuanianLumbeeLuxembourgerMacedonianMalaysianMalteseMarshalleseMenomineeMexicanMexican American IndianMongolianMoroccanNative HawaiianNavajoNew ZealanderNicaraguanNigerianNorthern EuropeanNorwegianOkinawanOsageOttawaPaiutePakistaniPalestinianPanamanianParaguayanPennsylvania GermanPeruvianPimaPolishPortuguesePotawatomiPuebloPuerto RicanPuget Sound SalishRomanianRussianSalvadoranSamoanScandinavianScotch-IrishScottishSeminoleSenegaleseSerbianShoshoneSierra LeoneanSiouxSlavicSlovakSloveneSomaliSouth AfricanSouth AmericanSouth American IndianSoviet UnionSpaniardSpanishSpanish AmericanSpanish American IndianSri LankanSubsaharan AfricanSudaneseSwedishSwissSyrianTaiwaneseThaiTlingit-HaidaTohono O'OdhamTonganTrinidadian and TobagonianTsimshianTurkishU.S. Virgin IslanderUgandanUkrainianUruguayanUteVenezuelanVietnameseWelshWest IndianYakamaYaquiYugoslavianYumanYup'ikZimbabwean
Immigration
NonimmigrantsImmigrantsAfghanistanAfricaAlbaniaArgentinaArmeniaAsiaAustraliaAustriaBahamasBangladeshBarbadosBelarusBelgiumBelizeBoliviaBosnia and HerzegovinaBrazilBulgariaBurma/MyanmarCabo VerdeCambodiaCameroonCanadaCaribbeanCentral AmericaChileChinaColombiaCongoCosta RicaCroatiaCubaCzechoslovakiaDenmarkDominicaDominican RepublicEastern AfricaEastern AsiaEastern EuropeEcuadorEgyptEl SalvadorEnglandEritreaEthiopiaEuropeFijiFranceGermanyGhanaGreeceGrenadaGuatemalaGuyanaHaitiHondurasHong KongHungaryIndiaIndonesiaIranIraqIrelandIsraelItalyJamaicaJapanJordanKazakhstanKenyaKoreaKuwaitLaosLatin AmericaLatviaLebanonLiberiaLithuaniaMalaysiaMexicoMicronesiaMiddle AfricaMoldovaMoroccoNepalNetherlandsNicaraguaNigeriaNorth AmericaNorth MacedoniaNorthern AfricaNorthern EuropeNorwayOceaniaPakistanPanamaPeruPhilippinesPolandPortugalRomaniaRussiaSaudi ArabiaScotlandSenegalSerbiaSierra LeoneSingaporeSomaliaSouth AfricaSouth AmericaSouth Central AsiaSouth Eastern AsiaSouthern EuropeSpainSri LankaSt. Vincent and the GrenadinesSudanSwedenSwitzerlandSyriaTaiwanThailandTrinidad and TobagoTurkeyUgandaUkraineUruguayUzbekistanVenezuelaVietnamWest IndiesWestern AfricaWestern AsiaWestern EuropeYemenZaireZimbabweAzores
Single Father Households
Income
Poverty
Unemployment
Labor Participation
Family Structure
Vehicle Availability
Education Level
Disability

Single Father Households Comparison

Nepalese

Bhutanese

Tragic
Exceptional
3.1%
SINGLE FATHER HOUSEHOLDS
0.0/ 100
METRIC RATING
330th/ 347
METRIC RANK
2.1%
SINGLE FATHER HOUSEHOLDS
99.5/ 100
METRIC RATING
88th/ 347
METRIC RANK

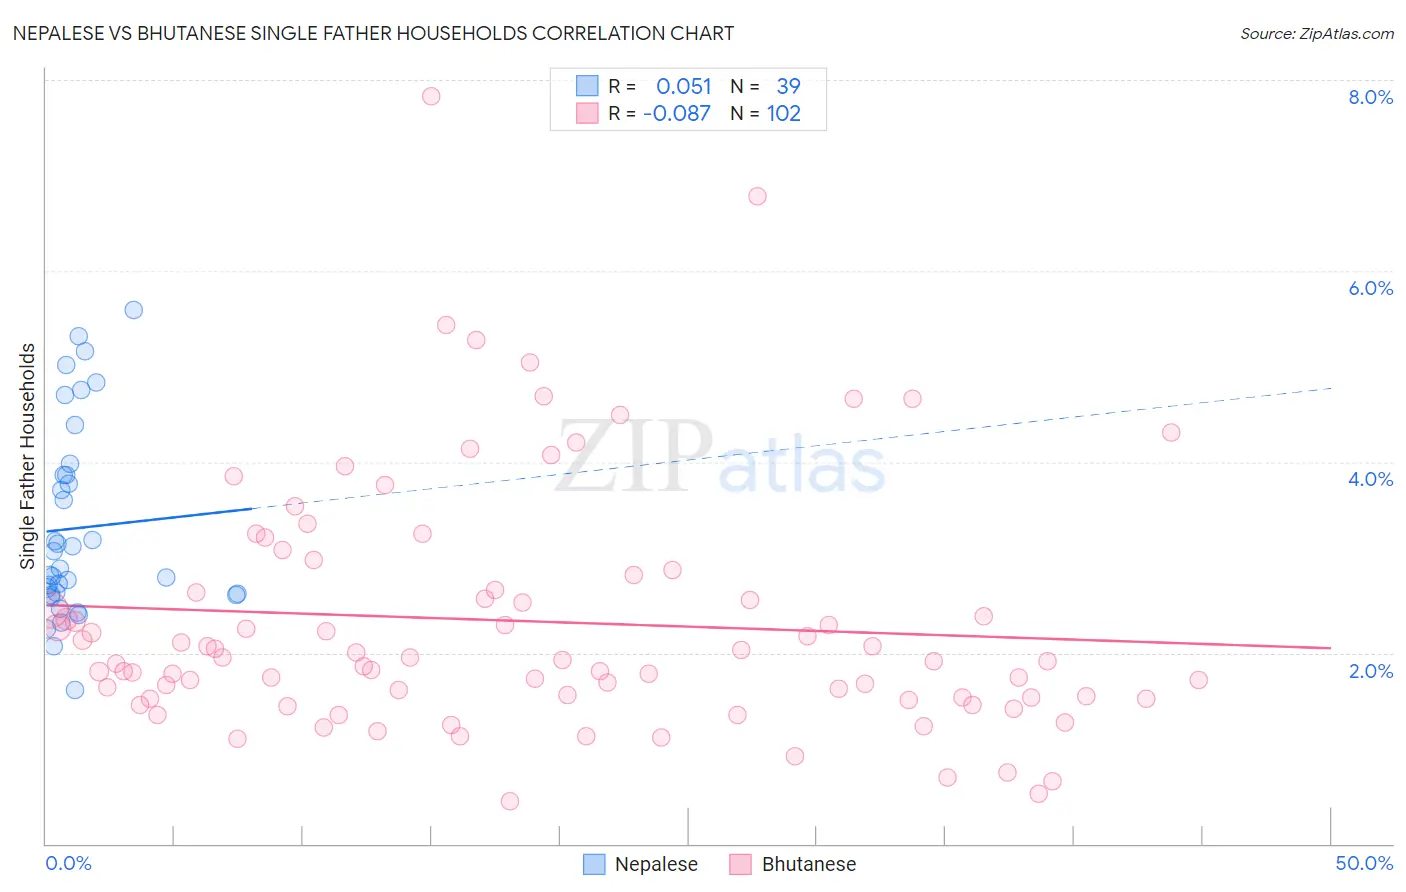
Nepalese vs Bhutanese Single Father Households Correlation Chart

The statistical analysis conducted on geographies consisting of 24,491,034 people shows a slight positive correlation between the proportion of Nepalese and percentage of single father households in the United States with a correlation coefficient (R) of 0.051 and weighted average of 3.1%. Similarly, the statistical analysis conducted on geographies consisting of 450,482,279 people shows a slight negative correlation between the proportion of Bhutanese and percentage of single father households in the United States with a correlation coefficient (R) of -0.087 and weighted average of 2.1%, a difference of 47.6%.
Nepalese vs Bhutanese Single Father Households

Single Father Households Correlation Summary

MeasurementNepaleseBhutanese
Minimum1.6%0.45%
Maximum5.6%7.8%
Range4.0%7.4%
Mean3.3%2.3%
Median2.9%1.9%
Interquartile 25% (IQ1)2.6%1.5%
Interquartile 75% (IQ3)3.9%2.7%
Interquartile Range (IQR)1.3%1.1%
Standard Deviation (Sample)1.0%1.3%
Standard Deviation (Population)0.99%1.3%

Similar Demographics by Single Father Households

Demographics Similar to Nepalese by Single Father Households

In terms of single father households, the demographic groups most similar to Nepalese are Chippewa (3.1%, a difference of 0.88%), Immigrants from Cabo Verde (3.1%, a difference of 0.98%), Bangladeshi (3.1%, a difference of 1.5%), Navajo (3.2%, a difference of 2.3%), and Yaqui (3.2%, a difference of 2.3%).
DemographicsRating | RankSingle Father Households
Immigrants | Central America
0.0
/100
|
#323
Tragic
3.0%
Fijians
0.0
/100
|
#324
Tragic
3.0%
Immigrants | Mexico
0.0
/100
|
#325
Tragic
3.0%
Aleuts
0.0
/100
|
#326
Tragic
3.0%
Bangladeshis
0.0
/100
|
#327
Tragic
3.1%
Immigrants | Cabo Verde
0.0
/100
|
#328
Tragic
3.1%
Chippewa
0.0
/100
|
#329
Tragic
3.1%
Nepalese
0.0
/100
|
#330
Tragic
3.1%
Navajo
0.0
/100
|
#331
Tragic
3.2%
Yaqui
0.0
/100
|
#332
Tragic
3.2%
Natives/Alaskans
0.0
/100
|
#333
Tragic
3.2%
Yuman
0.0
/100
|
#334
Tragic
3.3%
Colville
0.0
/100
|
#335
Tragic
3.3%
Paiute
0.0
/100
|
#336
Tragic
3.3%
Pueblo
0.0
/100
|
#337
Tragic
3.3%

Demographics Similar to Bhutanese by Single Father Households

In terms of single father households, the demographic groups most similar to Bhutanese are Immigrants from Armenia (2.1%, a difference of 0.050%), Immigrants from Pakistan (2.1%, a difference of 0.060%), Lithuanian (2.1%, a difference of 0.13%), Immigrants from Guyana (2.1%, a difference of 0.30%), and Romanian (2.1%, a difference of 0.39%).
DemographicsRating | RankSingle Father Households
Armenians
99.7
/100
|
#81
Exceptional
2.1%
New Zealanders
99.7
/100
|
#82
Exceptional
2.1%
Greeks
99.7
/100
|
#83
Exceptional
2.1%
Carpatho Rusyns
99.6
/100
|
#84
Exceptional
2.1%
Immigrants | Hungary
99.6
/100
|
#85
Exceptional
2.1%
Asians
99.6
/100
|
#86
Exceptional
2.1%
Lithuanians
99.5
/100
|
#87
Exceptional
2.1%
Bhutanese
99.5
/100
|
#88
Exceptional
2.1%
Immigrants | Armenia
99.5
/100
|
#89
Exceptional
2.1%
Immigrants | Pakistan
99.5
/100
|
#90
Exceptional
2.1%
Immigrants | Guyana
99.4
/100
|
#91
Exceptional
2.1%
Romanians
99.4
/100
|
#92
Exceptional
2.1%
Croatians
99.3
/100
|
#93
Exceptional
2.1%
Ukrainians
99.3
/100
|
#94
Exceptional
2.1%
Bermudans
99.2
/100
|
#95
Exceptional
2.1%