Nepalese vs Austrian Single Father Households
COMPARE
Nepalese
Austrian
Single Father Households
Single Father Households Comparison
Nepalese
Austrians
3.1%
SINGLE FATHER HOUSEHOLDS
0.0/ 100
METRIC RATING
330th/ 347
METRIC RANK
2.2%
SINGLE FATHER HOUSEHOLDS
94.2/ 100
METRIC RATING
137th/ 347
METRIC RANK
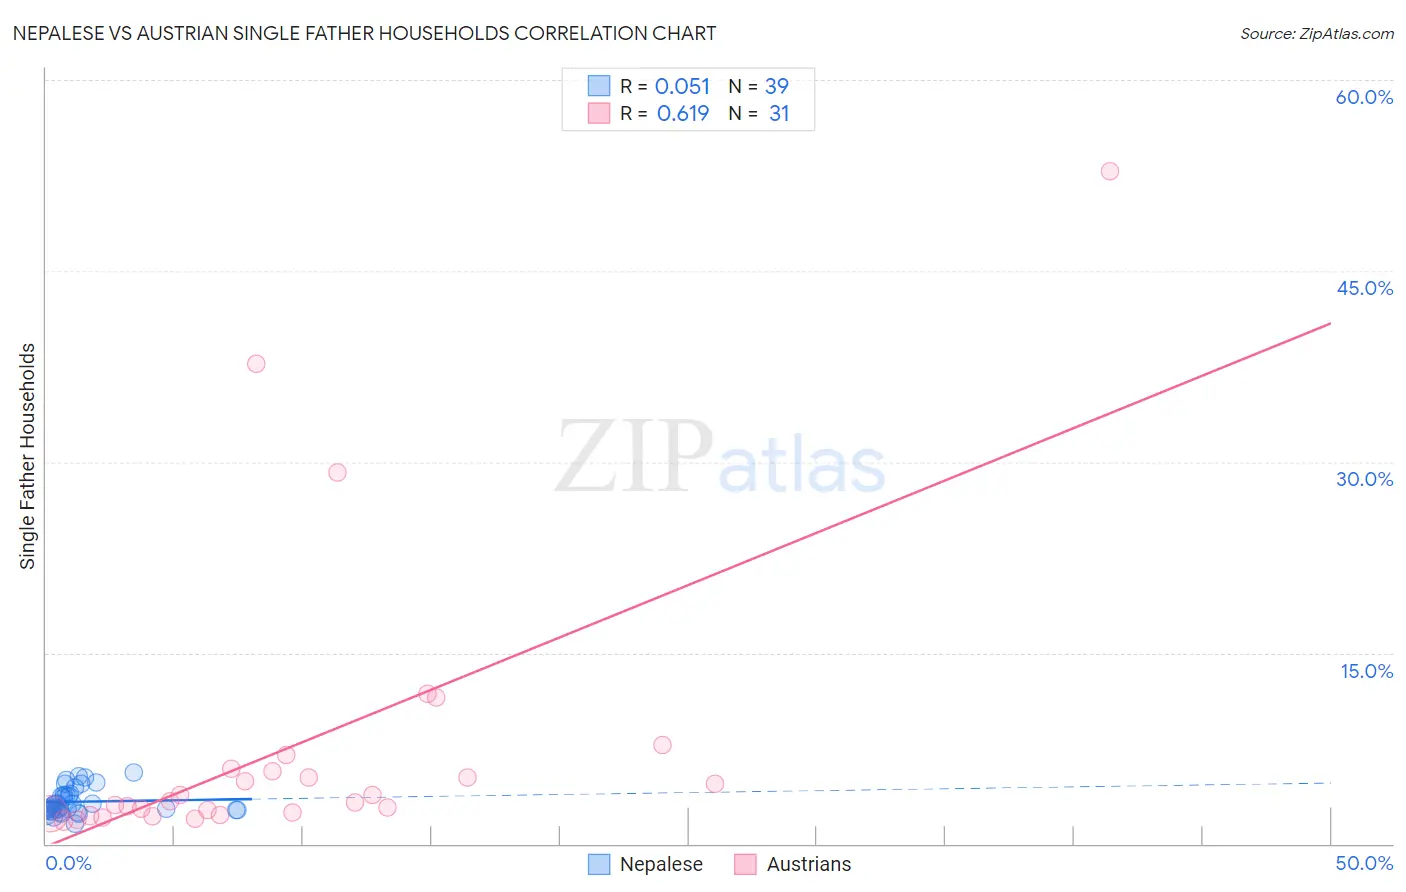
Nepalese vs Austrian Single Father Households Correlation Chart
The statistical analysis conducted on geographies consisting of 24,491,034 people shows a slight positive correlation between the proportion of Nepalese and percentage of single father households in the United States with a correlation coefficient (R) of 0.051 and weighted average of 3.1%. Similarly, the statistical analysis conducted on geographies consisting of 445,997,732 people shows a significant positive correlation between the proportion of Austrians and percentage of single father households in the United States with a correlation coefficient (R) of 0.619 and weighted average of 2.2%, a difference of 40.6%.
Single Father Households Correlation Summary
| Measurement | Nepalese | Austrian |
| Minimum | 1.6% | 1.8% |
| Maximum | 5.6% | 52.8% |
| Range | 4.0% | 51.0% |
| Mean | 3.3% | 7.7% |
| Median | 2.9% | 3.4% |
| Interquartile 25% (IQ1) | 2.6% | 2.3% |
| Interquartile 75% (IQ3) | 3.9% | 5.9% |
| Interquartile Range (IQR) | 1.3% | 3.6% |
| Standard Deviation (Sample) | 1.0% | 11.4% |
| Standard Deviation (Population) | 0.99% | 11.3% |
Similar Demographics by Single Father Households
Demographics Similar to Nepalese by Single Father Households
In terms of single father households, the demographic groups most similar to Nepalese are Chippewa (3.1%, a difference of 0.88%), Immigrants from Cabo Verde (3.1%, a difference of 0.98%), Bangladeshi (3.1%, a difference of 1.5%), Navajo (3.2%, a difference of 2.3%), and Yaqui (3.2%, a difference of 2.3%).
| Demographics | Rating | Rank | Single Father Households |
| Immigrants | Central America | 0.0 /100 | #323 | Tragic 3.0% |
| Fijians | 0.0 /100 | #324 | Tragic 3.0% |
| Immigrants | Mexico | 0.0 /100 | #325 | Tragic 3.0% |
| Aleuts | 0.0 /100 | #326 | Tragic 3.0% |
| Bangladeshis | 0.0 /100 | #327 | Tragic 3.1% |
| Immigrants | Cabo Verde | 0.0 /100 | #328 | Tragic 3.1% |
| Chippewa | 0.0 /100 | #329 | Tragic 3.1% |
| Nepalese | 0.0 /100 | #330 | Tragic 3.1% |
| Navajo | 0.0 /100 | #331 | Tragic 3.2% |
| Yaqui | 0.0 /100 | #332 | Tragic 3.2% |
| Natives/Alaskans | 0.0 /100 | #333 | Tragic 3.2% |
| Yuman | 0.0 /100 | #334 | Tragic 3.3% |
| Colville | 0.0 /100 | #335 | Tragic 3.3% |
| Paiute | 0.0 /100 | #336 | Tragic 3.3% |
| Pueblo | 0.0 /100 | #337 | Tragic 3.3% |
Demographics Similar to Austrians by Single Father Households
In terms of single father households, the demographic groups most similar to Austrians are West Indian (2.2%, a difference of 0.030%), Chilean (2.2%, a difference of 0.11%), Syrian (2.2%, a difference of 0.23%), Zimbabwean (2.2%, a difference of 0.34%), and Brazilian (2.2%, a difference of 0.45%).
| Demographics | Rating | Rank | Single Father Households |
| Immigrants | Chile | 96.7 /100 | #130 | Exceptional 2.2% |
| Immigrants | Jordan | 96.6 /100 | #131 | Exceptional 2.2% |
| Poles | 96.5 /100 | #132 | Exceptional 2.2% |
| Taiwanese | 96.3 /100 | #133 | Exceptional 2.2% |
| Zimbabweans | 95.1 /100 | #134 | Exceptional 2.2% |
| Syrians | 94.8 /100 | #135 | Exceptional 2.2% |
| Chileans | 94.5 /100 | #136 | Exceptional 2.2% |
| Austrians | 94.2 /100 | #137 | Exceptional 2.2% |
| West Indians | 94.1 /100 | #138 | Exceptional 2.2% |
| Brazilians | 92.8 /100 | #139 | Exceptional 2.2% |
| British | 92.8 /100 | #140 | Exceptional 2.2% |
| Laotians | 92.5 /100 | #141 | Exceptional 2.2% |
| Luxembourgers | 92.3 /100 | #142 | Exceptional 2.2% |
| Immigrants | Nepal | 92.1 /100 | #143 | Exceptional 2.2% |
| Slovaks | 90.7 /100 | #144 | Exceptional 2.2% |