Nepalese vs Bhutanese Cognitive Disability
COMPARE
Nepalese
Bhutanese
Cognitive Disability
Cognitive Disability Comparison
Nepalese
Bhutanese
18.0%
COGNITIVE DISABILITY
0.3/ 100
METRIC RATING
267th/ 347
METRIC RANK
16.6%
COGNITIVE DISABILITY
99.7/ 100
METRIC RATING
57th/ 347
METRIC RANK
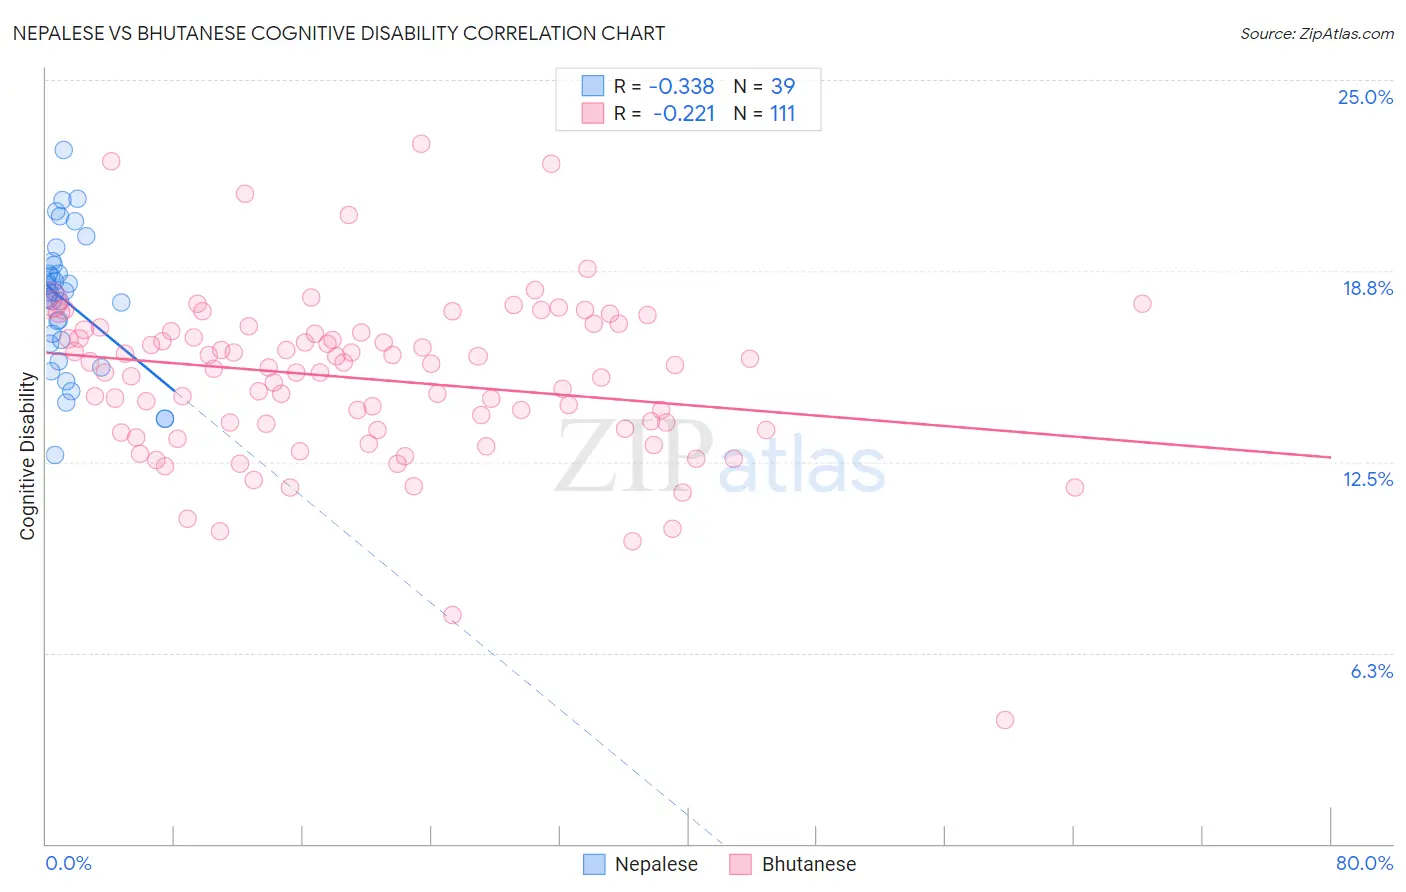
Nepalese vs Bhutanese Cognitive Disability Correlation Chart
The statistical analysis conducted on geographies consisting of 24,519,269 people shows a mild negative correlation between the proportion of Nepalese and percentage of population with cognitive disability in the United States with a correlation coefficient (R) of -0.338 and weighted average of 18.0%. Similarly, the statistical analysis conducted on geographies consisting of 455,511,378 people shows a weak negative correlation between the proportion of Bhutanese and percentage of population with cognitive disability in the United States with a correlation coefficient (R) of -0.221 and weighted average of 16.6%, a difference of 8.5%.
Cognitive Disability Correlation Summary
| Measurement | Nepalese | Bhutanese |
| Minimum | 12.7% | 4.0% |
| Maximum | 22.7% | 22.9% |
| Range | 10.0% | 18.9% |
| Mean | 17.7% | 15.2% |
| Median | 18.0% | 15.6% |
| Interquartile 25% (IQ1) | 16.4% | 13.6% |
| Interquartile 75% (IQ3) | 18.9% | 16.8% |
| Interquartile Range (IQR) | 2.6% | 3.2% |
| Standard Deviation (Sample) | 2.2% | 2.8% |
| Standard Deviation (Population) | 2.2% | 2.7% |
Similar Demographics by Cognitive Disability
Demographics Similar to Nepalese by Cognitive Disability
In terms of cognitive disability, the demographic groups most similar to Nepalese are Cherokee (18.0%, a difference of 0.010%), Spanish American (18.0%, a difference of 0.060%), Belizean (18.0%, a difference of 0.060%), Menominee (18.0%, a difference of 0.090%), and Immigrants from Barbados (17.9%, a difference of 0.15%).
| Demographics | Rating | Rank | Cognitive Disability |
| Immigrants | Belize | 0.5 /100 | #260 | Tragic 17.9% |
| Guamanians/Chamorros | 0.5 /100 | #261 | Tragic 17.9% |
| Sierra Leoneans | 0.4 /100 | #262 | Tragic 17.9% |
| Immigrants | Barbados | 0.4 /100 | #263 | Tragic 17.9% |
| Menominee | 0.4 /100 | #264 | Tragic 18.0% |
| Spanish Americans | 0.4 /100 | #265 | Tragic 18.0% |
| Belizeans | 0.4 /100 | #266 | Tragic 18.0% |
| Nepalese | 0.3 /100 | #267 | Tragic 18.0% |
| Cherokee | 0.3 /100 | #268 | Tragic 18.0% |
| Hondurans | 0.3 /100 | #269 | Tragic 18.0% |
| Immigrants | Bahamas | 0.3 /100 | #270 | Tragic 18.0% |
| Potawatomi | 0.2 /100 | #271 | Tragic 18.0% |
| Immigrants | Honduras | 0.2 /100 | #272 | Tragic 18.0% |
| Immigrants | Nepal | 0.2 /100 | #273 | Tragic 18.0% |
| Immigrants | Nigeria | 0.2 /100 | #274 | Tragic 18.0% |
Demographics Similar to Bhutanese by Cognitive Disability
In terms of cognitive disability, the demographic groups most similar to Bhutanese are Austrian (16.6%, a difference of 0.010%), Pennsylvania German (16.6%, a difference of 0.080%), Immigrants from Peru (16.6%, a difference of 0.080%), Romanian (16.6%, a difference of 0.090%), and Immigrants from Venezuela (16.5%, a difference of 0.10%).
| Demographics | Rating | Rank | Cognitive Disability |
| Norwegians | 99.8 /100 | #50 | Exceptional 16.5% |
| Immigrants | Korea | 99.8 /100 | #51 | Exceptional 16.5% |
| Soviet Union | 99.8 /100 | #52 | Exceptional 16.5% |
| Swedes | 99.8 /100 | #53 | Exceptional 16.5% |
| Immigrants | Iran | 99.8 /100 | #54 | Exceptional 16.5% |
| Immigrants | Venezuela | 99.7 /100 | #55 | Exceptional 16.5% |
| Austrians | 99.7 /100 | #56 | Exceptional 16.6% |
| Bhutanese | 99.7 /100 | #57 | Exceptional 16.6% |
| Pennsylvania Germans | 99.7 /100 | #58 | Exceptional 16.6% |
| Immigrants | Peru | 99.7 /100 | #59 | Exceptional 16.6% |
| Romanians | 99.7 /100 | #60 | Exceptional 16.6% |
| Immigrants | England | 99.6 /100 | #61 | Exceptional 16.6% |
| Czechoslovakians | 99.6 /100 | #62 | Exceptional 16.6% |
| Argentineans | 99.6 /100 | #63 | Exceptional 16.6% |
| Venezuelans | 99.6 /100 | #64 | Exceptional 16.6% |