Cree vs Bhutanese Single Father Households
COMPARE
Cree
Bhutanese
Single Father Households
Single Father Households Comparison
Cree
Bhutanese
2.8%
SINGLE FATHER HOUSEHOLDS
0.0/ 100
METRIC RATING
298th/ 347
METRIC RANK
2.1%
SINGLE FATHER HOUSEHOLDS
99.5/ 100
METRIC RATING
88th/ 347
METRIC RANK
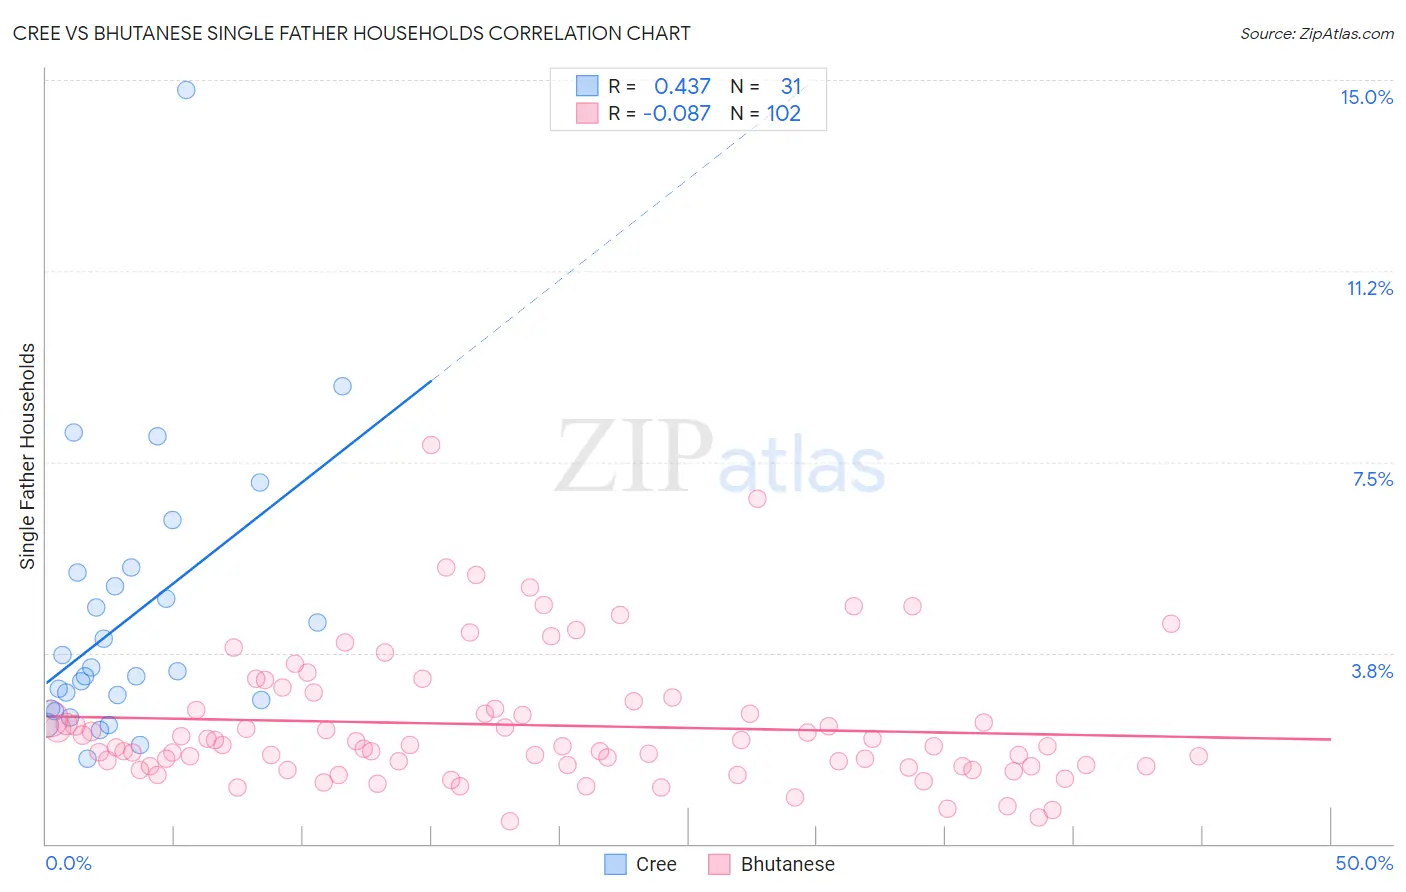
Cree vs Bhutanese Single Father Households Correlation Chart
The statistical analysis conducted on geographies consisting of 76,112,534 people shows a moderate positive correlation between the proportion of Cree and percentage of single father households in the United States with a correlation coefficient (R) of 0.437 and weighted average of 2.8%. Similarly, the statistical analysis conducted on geographies consisting of 450,482,279 people shows a slight negative correlation between the proportion of Bhutanese and percentage of single father households in the United States with a correlation coefficient (R) of -0.087 and weighted average of 2.1%, a difference of 31.0%.
Single Father Households Correlation Summary
| Measurement | Cree | Bhutanese |
| Minimum | 1.7% | 0.45% |
| Maximum | 14.8% | 7.8% |
| Range | 13.1% | 7.4% |
| Mean | 4.4% | 2.3% |
| Median | 3.4% | 1.9% |
| Interquartile 25% (IQ1) | 2.7% | 1.5% |
| Interquartile 75% (IQ3) | 5.3% | 2.7% |
| Interquartile Range (IQR) | 2.7% | 1.1% |
| Standard Deviation (Sample) | 2.7% | 1.3% |
| Standard Deviation (Population) | 2.7% | 1.3% |
Similar Demographics by Single Father Households
Demographics Similar to Cree by Single Father Households
In terms of single father households, the demographic groups most similar to Cree are Lumbee (2.8%, a difference of 0.38%), Honduran (2.8%, a difference of 0.49%), Japanese (2.8%, a difference of 0.57%), Chickasaw (2.8%, a difference of 0.59%), and Kiowa (2.8%, a difference of 0.77%).
| Demographics | Rating | Rank | Single Father Households |
| Blackfeet | 0.0 /100 | #291 | Tragic 2.7% |
| Choctaw | 0.0 /100 | #292 | Tragic 2.7% |
| Immigrants | Fiji | 0.0 /100 | #293 | Tragic 2.7% |
| Malaysians | 0.0 /100 | #294 | Tragic 2.7% |
| Chickasaw | 0.0 /100 | #295 | Tragic 2.8% |
| Japanese | 0.0 /100 | #296 | Tragic 2.8% |
| Hondurans | 0.0 /100 | #297 | Tragic 2.8% |
| Cree | 0.0 /100 | #298 | Tragic 2.8% |
| Lumbee | 0.0 /100 | #299 | Tragic 2.8% |
| Kiowa | 0.0 /100 | #300 | Tragic 2.8% |
| Immigrants | Latin America | 0.0 /100 | #301 | Tragic 2.8% |
| Spanish Americans | 0.0 /100 | #302 | Tragic 2.8% |
| Immigrants | Honduras | 0.0 /100 | #303 | Tragic 2.8% |
| Mexican American Indians | 0.0 /100 | #304 | Tragic 2.8% |
| Hispanics or Latinos | 0.0 /100 | #305 | Tragic 2.8% |
Demographics Similar to Bhutanese by Single Father Households
In terms of single father households, the demographic groups most similar to Bhutanese are Immigrants from Armenia (2.1%, a difference of 0.050%), Immigrants from Pakistan (2.1%, a difference of 0.060%), Lithuanian (2.1%, a difference of 0.13%), Immigrants from Guyana (2.1%, a difference of 0.30%), and Romanian (2.1%, a difference of 0.39%).
| Demographics | Rating | Rank | Single Father Households |
| Armenians | 99.7 /100 | #81 | Exceptional 2.1% |
| New Zealanders | 99.7 /100 | #82 | Exceptional 2.1% |
| Greeks | 99.7 /100 | #83 | Exceptional 2.1% |
| Carpatho Rusyns | 99.6 /100 | #84 | Exceptional 2.1% |
| Immigrants | Hungary | 99.6 /100 | #85 | Exceptional 2.1% |
| Asians | 99.6 /100 | #86 | Exceptional 2.1% |
| Lithuanians | 99.5 /100 | #87 | Exceptional 2.1% |
| Bhutanese | 99.5 /100 | #88 | Exceptional 2.1% |
| Immigrants | Armenia | 99.5 /100 | #89 | Exceptional 2.1% |
| Immigrants | Pakistan | 99.5 /100 | #90 | Exceptional 2.1% |
| Immigrants | Guyana | 99.4 /100 | #91 | Exceptional 2.1% |
| Romanians | 99.4 /100 | #92 | Exceptional 2.1% |
| Croatians | 99.3 /100 | #93 | Exceptional 2.1% |
| Ukrainians | 99.3 /100 | #94 | Exceptional 2.1% |
| Bermudans | 99.2 /100 | #95 | Exceptional 2.1% |