Navajo vs Jordanian Average Family Size
COMPARE
Navajo
Jordanian
Average Family Size
Average Family Size Comparison
Navajo
Jordanians
3.65
AVERAGE FAMILY SIZE
100.0/ 100
METRIC RATING
5th/ 347
METRIC RANK
3.24
AVERAGE FAMILY SIZE
73.5/ 100
METRIC RATING
151st/ 347
METRIC RANK
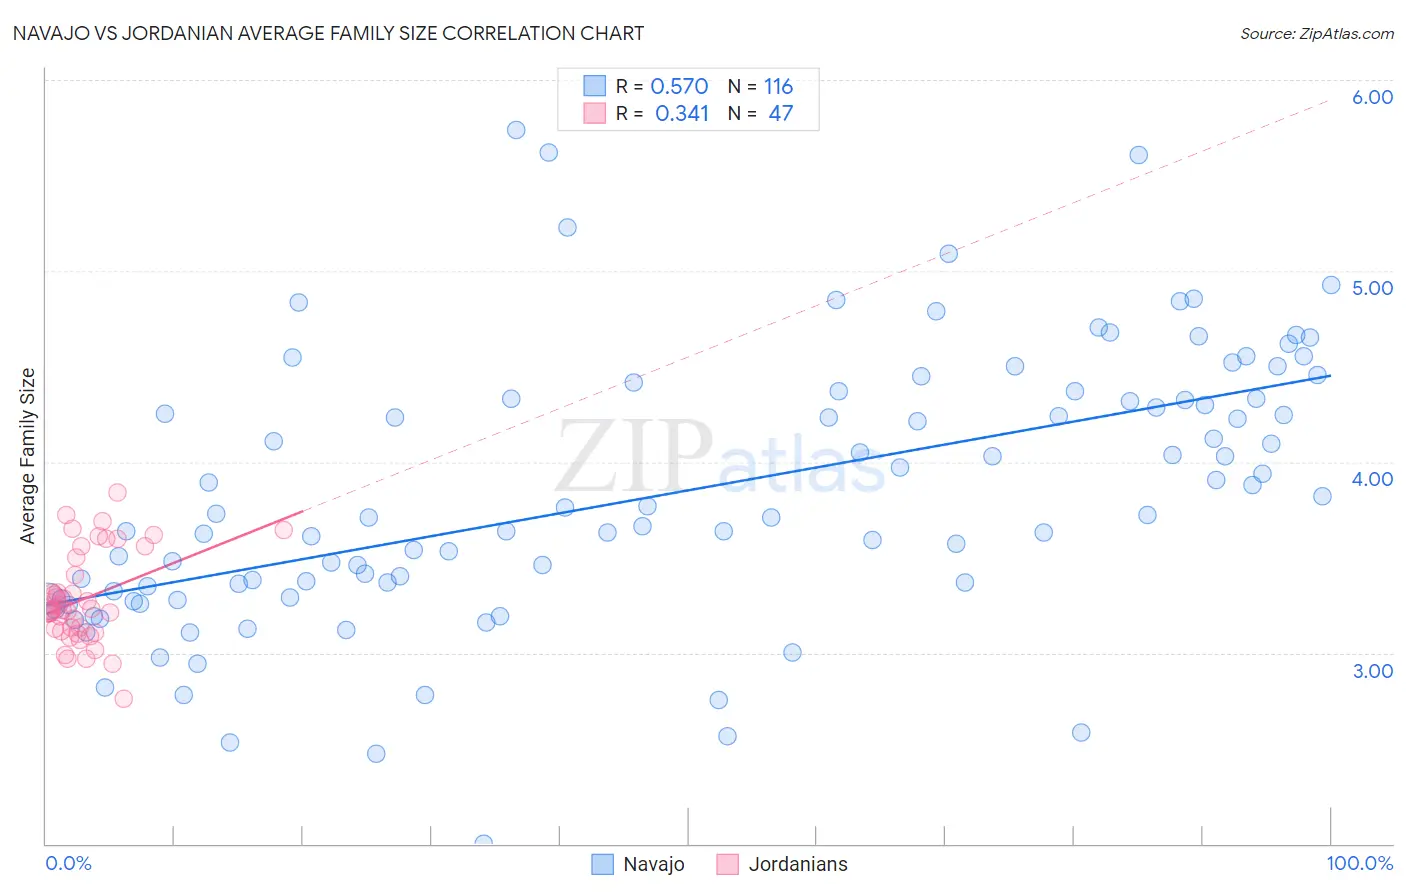
Navajo vs Jordanian Average Family Size Correlation Chart
The statistical analysis conducted on geographies consisting of 224,751,330 people shows a substantial positive correlation between the proportion of Navajo and average family size in the United States with a correlation coefficient (R) of 0.570 and weighted average of 3.65. Similarly, the statistical analysis conducted on geographies consisting of 166,395,405 people shows a mild positive correlation between the proportion of Jordanians and average family size in the United States with a correlation coefficient (R) of 0.341 and weighted average of 3.24, a difference of 12.4%.
Average Family Size Correlation Summary
| Measurement | Navajo | Jordanian |
| Minimum | 2.00 | 2.76 |
| Maximum | 5.74 | 3.84 |
| Range | 3.74 | 1.08 |
| Mean | 3.83 | 3.28 |
| Median | 3.71 | 3.22 |
| Interquartile 25% (IQ1) | 3.31 | 3.12 |
| Interquartile 75% (IQ3) | 4.33 | 3.50 |
| Interquartile Range (IQR) | 1.03 | 0.38 |
| Standard Deviation (Sample) | 0.71 | 0.24 |
| Standard Deviation (Population) | 0.71 | 0.24 |
Similar Demographics by Average Family Size
Demographics Similar to Navajo by Average Family Size
In terms of average family size, the demographic groups most similar to Navajo are Arapaho (3.64, a difference of 0.27%), Inupiat (3.63, a difference of 0.48%), Immigrants from Yemen (3.60, a difference of 1.3%), Hopi (3.60, a difference of 1.4%), and Spanish American Indian (3.58, a difference of 1.7%).
| Demographics | Rating | Rank | Average Family Size |
| Yup'ik | 100 /100 | #1 | Exceptional 4.00 |
| Crow | 100 /100 | #2 | Exceptional 3.82 |
| Pueblo | 100 /100 | #3 | Exceptional 3.79 |
| Pima | 100 /100 | #4 | Exceptional 3.75 |
| Navajo | 100.0 /100 | #5 | Exceptional 3.65 |
| Arapaho | 100.0 /100 | #6 | Exceptional 3.64 |
| Inupiat | 100.0 /100 | #7 | Exceptional 3.63 |
| Immigrants | Yemen | 100.0 /100 | #8 | Exceptional 3.60 |
| Hopi | 100.0 /100 | #9 | Exceptional 3.60 |
| Spanish American Indians | 100.0 /100 | #10 | Exceptional 3.58 |
| Tohono O'odham | 100.0 /100 | #11 | Exceptional 3.53 |
| Immigrants | Mexico | 100.0 /100 | #12 | Exceptional 3.52 |
| Sioux | 100.0 /100 | #13 | Exceptional 3.52 |
| Immigrants | Central America | 100.0 /100 | #14 | Exceptional 3.49 |
| Tongans | 100.0 /100 | #15 | Exceptional 3.49 |
Demographics Similar to Jordanians by Average Family Size
In terms of average family size, the demographic groups most similar to Jordanians are Indian (Asian) (3.24, a difference of 0.0%), Assyrian/Chaldean/Syriac (3.24, a difference of 0.010%), Spanish American (3.24, a difference of 0.020%), Blackfeet (3.24, a difference of 0.040%), and Immigrants from Jordan (3.24, a difference of 0.050%).
| Demographics | Rating | Rank | Average Family Size |
| Tsimshian | 80.2 /100 | #144 | Excellent 3.25 |
| Armenians | 78.2 /100 | #145 | Good 3.25 |
| Immigrants | Africa | 77.9 /100 | #146 | Good 3.25 |
| Immigrants | Jordan | 75.7 /100 | #147 | Good 3.24 |
| Blackfeet | 75.0 /100 | #148 | Good 3.24 |
| Assyrians/Chaldeans/Syriacs | 73.8 /100 | #149 | Good 3.24 |
| Indians (Asian) | 73.6 /100 | #150 | Good 3.24 |
| Jordanians | 73.5 /100 | #151 | Good 3.24 |
| Spanish Americans | 72.5 /100 | #152 | Good 3.24 |
| Immigrants | Eritrea | 71.4 /100 | #153 | Good 3.24 |
| Immigrants | Egypt | 70.0 /100 | #154 | Good 3.24 |
| Seminole | 68.2 /100 | #155 | Good 3.24 |
| Immigrants | Taiwan | 68.1 /100 | #156 | Good 3.24 |
| Immigrants | Uzbekistan | 67.0 /100 | #157 | Good 3.24 |
| Iraqis | 64.3 /100 | #158 | Good 3.24 |