Navajo vs Immigrants from Kazakhstan Average Family Size
COMPARE
Navajo
Immigrants from Kazakhstan
Average Family Size
Average Family Size Comparison
Navajo
Immigrants from Kazakhstan
3.65
AVERAGE FAMILY SIZE
100.0/ 100
METRIC RATING
5th/ 347
METRIC RANK
3.17
AVERAGE FAMILY SIZE
1.5/ 100
METRIC RATING
256th/ 347
METRIC RANK
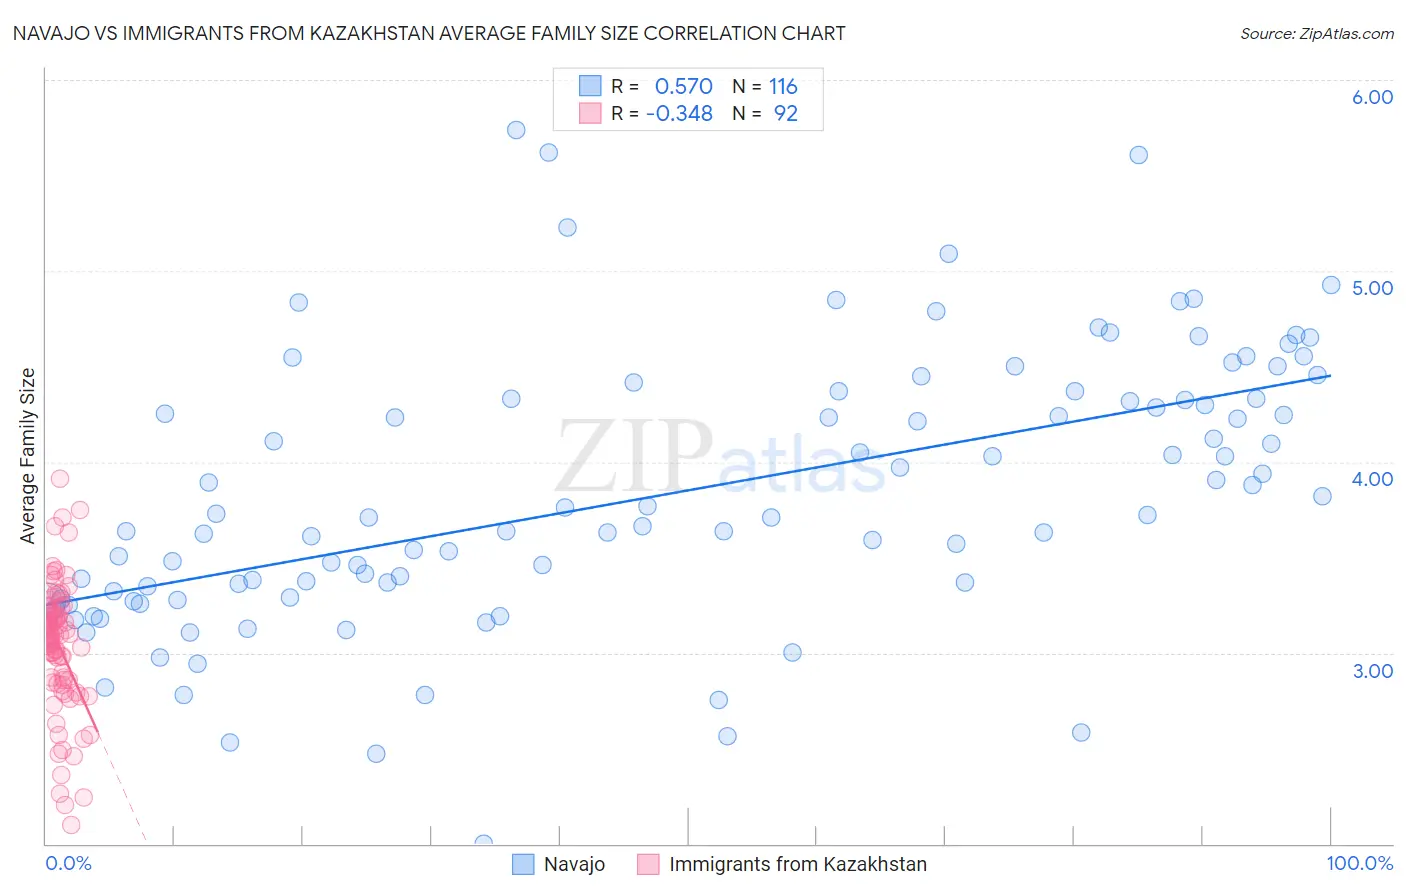
Navajo vs Immigrants from Kazakhstan Average Family Size Correlation Chart
The statistical analysis conducted on geographies consisting of 224,751,330 people shows a substantial positive correlation between the proportion of Navajo and average family size in the United States with a correlation coefficient (R) of 0.570 and weighted average of 3.65. Similarly, the statistical analysis conducted on geographies consisting of 124,429,118 people shows a mild negative correlation between the proportion of Immigrants from Kazakhstan and average family size in the United States with a correlation coefficient (R) of -0.348 and weighted average of 3.17, a difference of 15.1%.
Average Family Size Correlation Summary
| Measurement | Navajo | Immigrants from Kazakhstan |
| Minimum | 2.00 | 2.10 |
| Maximum | 5.74 | 3.91 |
| Range | 3.74 | 1.81 |
| Mean | 3.83 | 3.04 |
| Median | 3.71 | 3.09 |
| Interquartile 25% (IQ1) | 3.31 | 2.86 |
| Interquartile 75% (IQ3) | 4.33 | 3.23 |
| Interquartile Range (IQR) | 1.03 | 0.37 |
| Standard Deviation (Sample) | 0.71 | 0.34 |
| Standard Deviation (Population) | 0.71 | 0.33 |
Similar Demographics by Average Family Size
Demographics Similar to Navajo by Average Family Size
In terms of average family size, the demographic groups most similar to Navajo are Arapaho (3.64, a difference of 0.27%), Inupiat (3.63, a difference of 0.48%), Immigrants from Yemen (3.60, a difference of 1.3%), Hopi (3.60, a difference of 1.4%), and Spanish American Indian (3.58, a difference of 1.7%).
| Demographics | Rating | Rank | Average Family Size |
| Yup'ik | 100 /100 | #1 | Exceptional 4.00 |
| Crow | 100 /100 | #2 | Exceptional 3.82 |
| Pueblo | 100 /100 | #3 | Exceptional 3.79 |
| Pima | 100 /100 | #4 | Exceptional 3.75 |
| Navajo | 100.0 /100 | #5 | Exceptional 3.65 |
| Arapaho | 100.0 /100 | #6 | Exceptional 3.64 |
| Inupiat | 100.0 /100 | #7 | Exceptional 3.63 |
| Immigrants | Yemen | 100.0 /100 | #8 | Exceptional 3.60 |
| Hopi | 100.0 /100 | #9 | Exceptional 3.60 |
| Spanish American Indians | 100.0 /100 | #10 | Exceptional 3.58 |
| Tohono O'odham | 100.0 /100 | #11 | Exceptional 3.53 |
| Immigrants | Mexico | 100.0 /100 | #12 | Exceptional 3.52 |
| Sioux | 100.0 /100 | #13 | Exceptional 3.52 |
| Immigrants | Central America | 100.0 /100 | #14 | Exceptional 3.49 |
| Tongans | 100.0 /100 | #15 | Exceptional 3.49 |
Demographics Similar to Immigrants from Kazakhstan by Average Family Size
In terms of average family size, the demographic groups most similar to Immigrants from Kazakhstan are Albanian (3.17, a difference of 0.020%), Cape Verdean (3.17, a difference of 0.030%), South African (3.17, a difference of 0.040%), Immigrants from Hungary (3.17, a difference of 0.040%), and Immigrants from Saudi Arabia (3.17, a difference of 0.050%).
| Demographics | Rating | Rank | Average Family Size |
| Immigrants | Eastern Europe | 2.1 /100 | #249 | Tragic 3.17 |
| Puget Sound Salish | 1.9 /100 | #250 | Tragic 3.17 |
| Immigrants | Spain | 1.8 /100 | #251 | Tragic 3.17 |
| Immigrants | Saudi Arabia | 1.7 /100 | #252 | Tragic 3.17 |
| South Africans | 1.7 /100 | #253 | Tragic 3.17 |
| Immigrants | Hungary | 1.7 /100 | #254 | Tragic 3.17 |
| Cape Verdeans | 1.6 /100 | #255 | Tragic 3.17 |
| Immigrants | Kazakhstan | 1.5 /100 | #256 | Tragic 3.17 |
| Albanians | 1.5 /100 | #257 | Tragic 3.17 |
| Turks | 1.3 /100 | #258 | Tragic 3.16 |
| Potawatomi | 1.3 /100 | #259 | Tragic 3.16 |
| Immigrants | Albania | 1.3 /100 | #260 | Tragic 3.16 |
| Immigrants | North Macedonia | 1.3 /100 | #261 | Tragic 3.16 |
| Immigrants | Russia | 1.3 /100 | #262 | Tragic 3.16 |
| Immigrants | Bulgaria | 1.0 /100 | #263 | Tragic 3.16 |