Slavic vs Italian Average Family Size
COMPARE
Slavic
Italian
Average Family Size
Average Family Size Comparison
Slavs
Italians
3.13
AVERAGE FAMILY SIZE
0.1/ 100
METRIC RATING
308th/ 347
METRIC RANK
3.12
AVERAGE FAMILY SIZE
0.1/ 100
METRIC RATING
317th/ 347
METRIC RANK
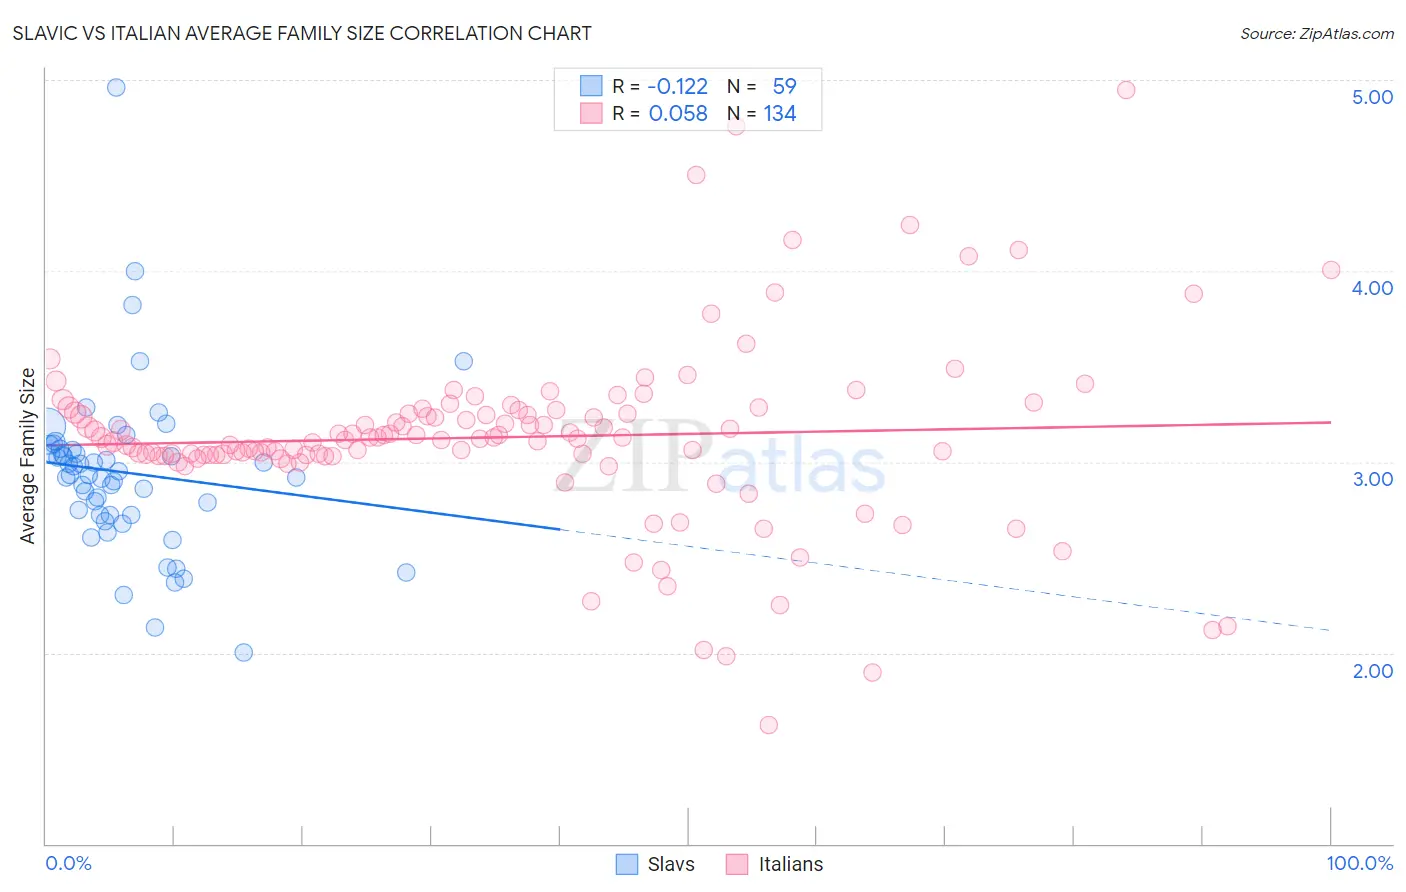
Slavic vs Italian Average Family Size Correlation Chart
The statistical analysis conducted on geographies consisting of 270,815,552 people shows a poor negative correlation between the proportion of Slavs and average family size in the United States with a correlation coefficient (R) of -0.122 and weighted average of 3.13. Similarly, the statistical analysis conducted on geographies consisting of 574,452,986 people shows a slight positive correlation between the proportion of Italians and average family size in the United States with a correlation coefficient (R) of 0.058 and weighted average of 3.12, a difference of 0.31%.
Average Family Size Correlation Summary
| Measurement | Slavic | Italian |
| Minimum | 2.00 | 1.62 |
| Maximum | 4.96 | 4.95 |
| Range | 2.96 | 3.33 |
| Mean | 2.94 | 3.13 |
| Median | 2.93 | 3.12 |
| Interquartile 25% (IQ1) | 2.72 | 3.04 |
| Interquartile 75% (IQ3) | 3.07 | 3.26 |
| Interquartile Range (IQR) | 0.35 | 0.22 |
| Standard Deviation (Sample) | 0.44 | 0.47 |
| Standard Deviation (Population) | 0.44 | 0.47 |
Demographics Similar to Slavs and Italians by Average Family Size
In terms of average family size, the demographic groups most similar to Slavs are Northern European (3.13, a difference of 0.010%), Czechoslovakian (3.13, a difference of 0.030%), Immigrants from Serbia (3.13, a difference of 0.050%), Immigrants from Ireland (3.13, a difference of 0.060%), and Immigrants from Northern Europe (3.13, a difference of 0.070%). Similarly, the demographic groups most similar to Italians are Eastern European (3.12, a difference of 0.010%), Welsh (3.12, a difference of 0.010%), Serbian (3.12, a difference of 0.060%), Immigrants from North America (3.12, a difference of 0.080%), and Immigrants from Austria (3.12, a difference of 0.11%).
| Demographics | Rating | Rank | Average Family Size |
| Immigrants | Latvia | 0.2 /100 | #302 | Tragic 3.13 |
| British | 0.2 /100 | #303 | Tragic 3.13 |
| Immigrants | Switzerland | 0.2 /100 | #304 | Tragic 3.13 |
| Australians | 0.1 /100 | #305 | Tragic 3.13 |
| Immigrants | Ireland | 0.1 /100 | #306 | Tragic 3.13 |
| Immigrants | Serbia | 0.1 /100 | #307 | Tragic 3.13 |
| Slavs | 0.1 /100 | #308 | Tragic 3.13 |
| Northern Europeans | 0.1 /100 | #309 | Tragic 3.13 |
| Czechoslovakians | 0.1 /100 | #310 | Tragic 3.13 |
| Immigrants | Northern Europe | 0.1 /100 | #311 | Tragic 3.13 |
| Immigrants | Australia | 0.1 /100 | #312 | Tragic 3.13 |
| Bulgarians | 0.1 /100 | #313 | Tragic 3.13 |
| Russians | 0.1 /100 | #314 | Tragic 3.12 |
| Immigrants | Scotland | 0.1 /100 | #315 | Tragic 3.12 |
| Serbians | 0.1 /100 | #316 | Tragic 3.12 |
| Italians | 0.1 /100 | #317 | Tragic 3.12 |
| Eastern Europeans | 0.1 /100 | #318 | Tragic 3.12 |
| Welsh | 0.1 /100 | #319 | Tragic 3.12 |
| Immigrants | North America | 0.0 /100 | #320 | Tragic 3.12 |
| Immigrants | Austria | 0.0 /100 | #321 | Tragic 3.12 |
| Immigrants | Canada | 0.0 /100 | #322 | Tragic 3.12 |