Vietnamese vs Bermudan Single Father Households
COMPARE
Vietnamese
Bermudan
Single Father Households
Single Father Households Comparison
Vietnamese
Bermudans
2.0%
SINGLE FATHER HOUSEHOLDS
99.9/ 100
METRIC RATING
61st/ 347
METRIC RANK
2.1%
SINGLE FATHER HOUSEHOLDS
99.2/ 100
METRIC RATING
95th/ 347
METRIC RANK
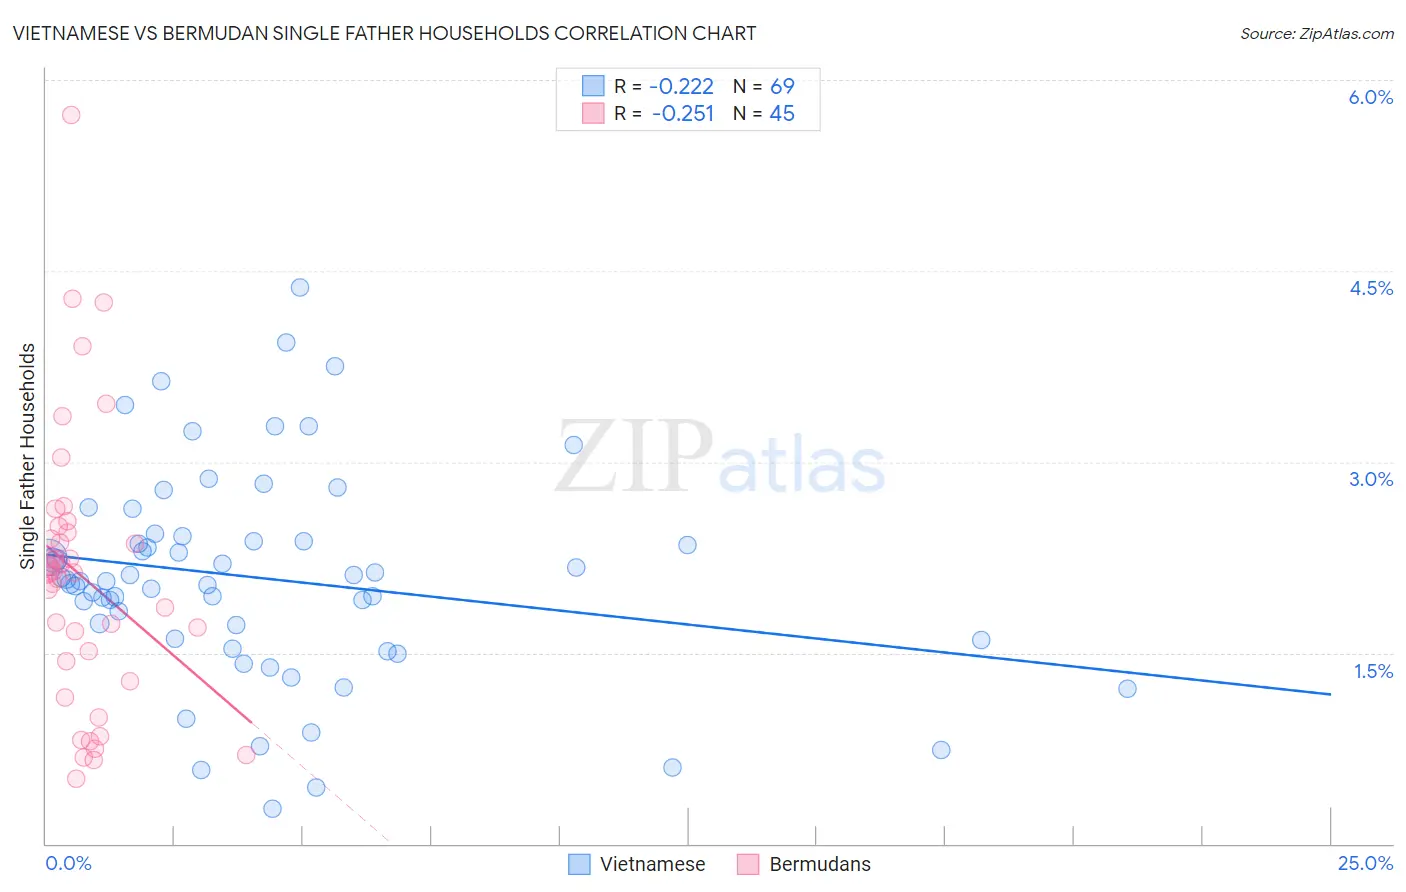
Vietnamese vs Bermudan Single Father Households Correlation Chart
The statistical analysis conducted on geographies consisting of 170,091,169 people shows a weak negative correlation between the proportion of Vietnamese and percentage of single father households in the United States with a correlation coefficient (R) of -0.222 and weighted average of 2.0%. Similarly, the statistical analysis conducted on geographies consisting of 55,647,509 people shows a weak negative correlation between the proportion of Bermudans and percentage of single father households in the United States with a correlation coefficient (R) of -0.251 and weighted average of 2.1%, a difference of 4.3%.
Single Father Households Correlation Summary
| Measurement | Vietnamese | Bermudan |
| Minimum | 0.28% | 0.51% |
| Maximum | 4.4% | 5.7% |
| Range | 4.1% | 5.2% |
| Mean | 2.1% | 2.1% |
| Median | 2.1% | 2.1% |
| Interquartile 25% (IQ1) | 1.6% | 1.4% |
| Interquartile 75% (IQ3) | 2.4% | 2.5% |
| Interquartile Range (IQR) | 0.79% | 1.1% |
| Standard Deviation (Sample) | 0.82% | 1.1% |
| Standard Deviation (Population) | 0.82% | 1.1% |
Similar Demographics by Single Father Households
Demographics Similar to Vietnamese by Single Father Households
In terms of single father households, the demographic groups most similar to Vietnamese are Immigrants from Malaysia (2.0%, a difference of 0.20%), Immigrants from Austria (2.0%, a difference of 0.24%), Immigrants from North Macedonia (2.0%, a difference of 0.25%), Immigrants from Czechoslovakia (2.0%, a difference of 0.35%), and Burmese (2.0%, a difference of 0.38%).
| Demographics | Rating | Rank | Single Father Households |
| Immigrants | Korea | 99.9 /100 | #54 | Exceptional 2.0% |
| Immigrants | France | 99.9 /100 | #55 | Exceptional 2.0% |
| Immigrants | Norway | 99.9 /100 | #56 | Exceptional 2.0% |
| Burmese | 99.9 /100 | #57 | Exceptional 2.0% |
| Immigrants | Czechoslovakia | 99.9 /100 | #58 | Exceptional 2.0% |
| Immigrants | North Macedonia | 99.9 /100 | #59 | Exceptional 2.0% |
| Immigrants | Austria | 99.9 /100 | #60 | Exceptional 2.0% |
| Vietnamese | 99.9 /100 | #61 | Exceptional 2.0% |
| Immigrants | Malaysia | 99.9 /100 | #62 | Exceptional 2.0% |
| Maltese | 99.9 /100 | #63 | Exceptional 2.0% |
| Mongolians | 99.9 /100 | #64 | Exceptional 2.1% |
| Paraguayans | 99.9 /100 | #65 | Exceptional 2.1% |
| Immigrants | Western Asia | 99.8 /100 | #66 | Exceptional 2.1% |
| Immigrants | Italy | 99.8 /100 | #67 | Exceptional 2.1% |
| Immigrants | Denmark | 99.8 /100 | #68 | Exceptional 2.1% |
Demographics Similar to Bermudans by Single Father Households
In terms of single father households, the demographic groups most similar to Bermudans are Arab (2.1%, a difference of 0.14%), Ukrainian (2.1%, a difference of 0.22%), Croatian (2.1%, a difference of 0.23%), Immigrants from Moldova (2.1%, a difference of 0.27%), and Romanian (2.1%, a difference of 0.33%).
| Demographics | Rating | Rank | Single Father Households |
| Bhutanese | 99.5 /100 | #88 | Exceptional 2.1% |
| Immigrants | Armenia | 99.5 /100 | #89 | Exceptional 2.1% |
| Immigrants | Pakistan | 99.5 /100 | #90 | Exceptional 2.1% |
| Immigrants | Guyana | 99.4 /100 | #91 | Exceptional 2.1% |
| Romanians | 99.4 /100 | #92 | Exceptional 2.1% |
| Croatians | 99.3 /100 | #93 | Exceptional 2.1% |
| Ukrainians | 99.3 /100 | #94 | Exceptional 2.1% |
| Bermudans | 99.2 /100 | #95 | Exceptional 2.1% |
| Arabs | 99.2 /100 | #96 | Exceptional 2.1% |
| Immigrants | Moldova | 99.1 /100 | #97 | Exceptional 2.1% |
| Guyanese | 99.1 /100 | #98 | Exceptional 2.1% |
| South Africans | 99.1 /100 | #99 | Exceptional 2.1% |
| Immigrants | Northern Africa | 99.0 /100 | #100 | Exceptional 2.1% |
| Immigrants | Western Europe | 98.9 /100 | #101 | Exceptional 2.1% |
| Argentineans | 98.9 /100 | #102 | Exceptional 2.1% |