Immigrants from Taiwan vs Bermudan Single Father Households
COMPARE
Immigrants from Taiwan
Bermudan
Single Father Households
Single Father Households Comparison
Immigrants from Taiwan
Bermudans
1.8%
SINGLE FATHER HOUSEHOLDS
100.0/ 100
METRIC RATING
6th/ 347
METRIC RANK
2.1%
SINGLE FATHER HOUSEHOLDS
99.2/ 100
METRIC RATING
95th/ 347
METRIC RANK
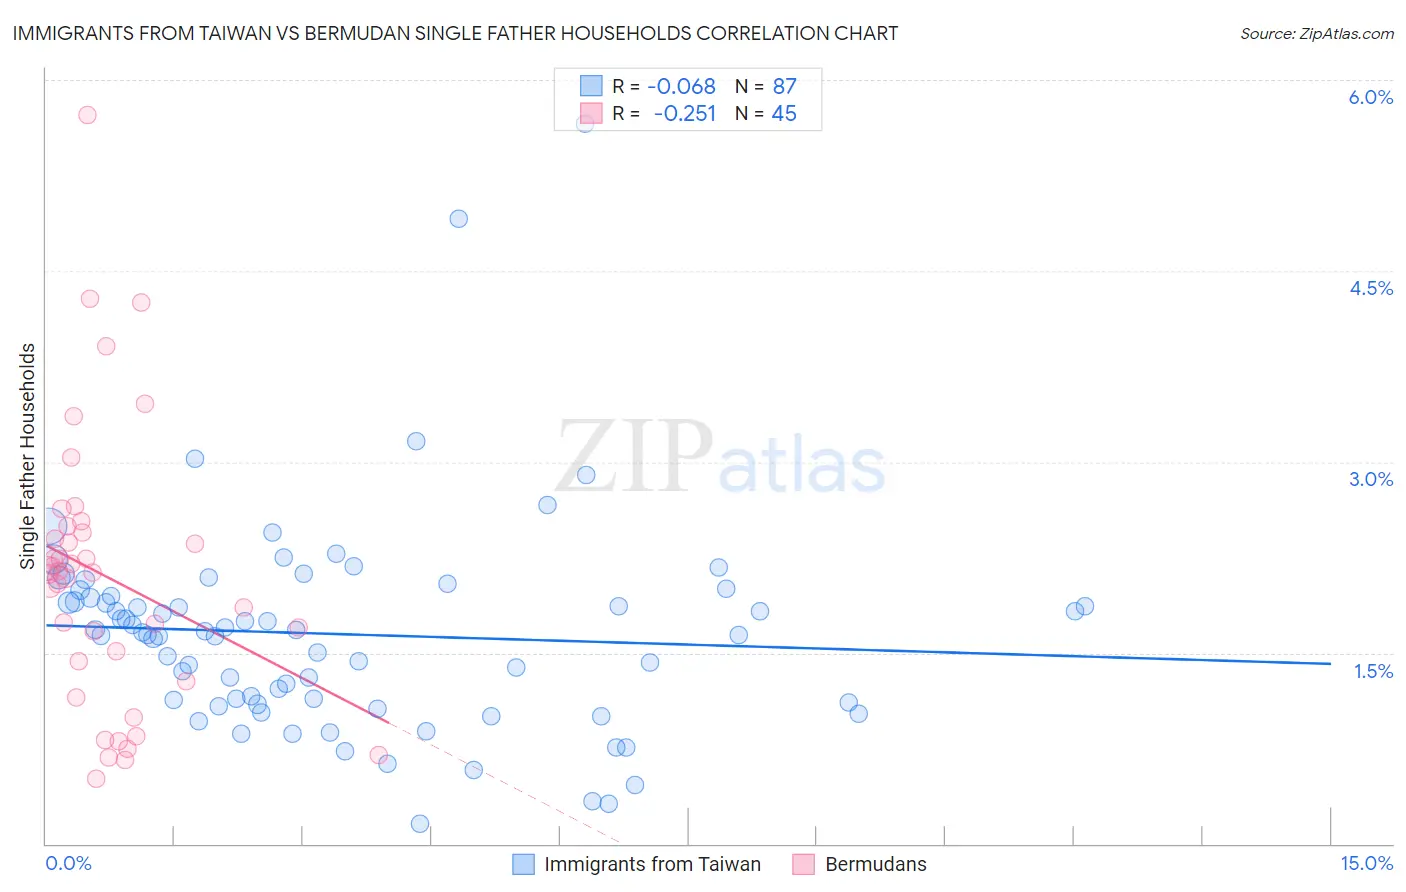
Immigrants from Taiwan vs Bermudan Single Father Households Correlation Chart
The statistical analysis conducted on geographies consisting of 296,358,565 people shows a slight negative correlation between the proportion of Immigrants from Taiwan and percentage of single father households in the United States with a correlation coefficient (R) of -0.068 and weighted average of 1.8%. Similarly, the statistical analysis conducted on geographies consisting of 55,647,509 people shows a weak negative correlation between the proportion of Bermudans and percentage of single father households in the United States with a correlation coefficient (R) of -0.251 and weighted average of 2.1%, a difference of 15.8%.
Single Father Households Correlation Summary
| Measurement | Immigrants from Taiwan | Bermudan |
| Minimum | 0.15% | 0.51% |
| Maximum | 5.7% | 5.7% |
| Range | 5.5% | 5.2% |
| Mean | 1.6% | 2.1% |
| Median | 1.7% | 2.1% |
| Interquartile 25% (IQ1) | 1.1% | 1.4% |
| Interquartile 75% (IQ3) | 1.9% | 2.5% |
| Interquartile Range (IQR) | 0.84% | 1.1% |
| Standard Deviation (Sample) | 0.82% | 1.1% |
| Standard Deviation (Population) | 0.82% | 1.1% |
Similar Demographics by Single Father Households
Demographics Similar to Immigrants from Taiwan by Single Father Households
In terms of single father households, the demographic groups most similar to Immigrants from Taiwan are Cypriot (1.8%, a difference of 0.16%), Immigrants from Ireland (1.8%, a difference of 0.27%), Immigrants from Hong Kong (1.8%, a difference of 0.37%), Immigrants from China (1.8%, a difference of 0.40%), and Okinawan (1.9%, a difference of 0.76%).
| Demographics | Rating | Rank | Single Father Households |
| Soviet Union | 100.0 /100 | #1 | Exceptional 1.8% |
| Immigrants | Israel | 100.0 /100 | #2 | Exceptional 1.8% |
| Filipinos | 100.0 /100 | #3 | Exceptional 1.8% |
| Immigrants | Uzbekistan | 100.0 /100 | #4 | Exceptional 1.8% |
| Immigrants | Hong Kong | 100.0 /100 | #5 | Exceptional 1.8% |
| Immigrants | Taiwan | 100.0 /100 | #6 | Exceptional 1.8% |
| Cypriots | 100.0 /100 | #7 | Exceptional 1.8% |
| Immigrants | Ireland | 100.0 /100 | #8 | Exceptional 1.8% |
| Immigrants | China | 100.0 /100 | #9 | Exceptional 1.8% |
| Okinawans | 100.0 /100 | #10 | Exceptional 1.9% |
| Immigrants | Belarus | 100.0 /100 | #11 | Exceptional 1.9% |
| Immigrants | Greece | 100.0 /100 | #12 | Exceptional 1.9% |
| Immigrants | Singapore | 100.0 /100 | #13 | Exceptional 1.9% |
| Immigrants | Lithuania | 100.0 /100 | #14 | Exceptional 1.9% |
| Immigrants | Eastern Asia | 100.0 /100 | #15 | Exceptional 1.9% |
Demographics Similar to Bermudans by Single Father Households
In terms of single father households, the demographic groups most similar to Bermudans are Arab (2.1%, a difference of 0.14%), Ukrainian (2.1%, a difference of 0.22%), Croatian (2.1%, a difference of 0.23%), Immigrants from Moldova (2.1%, a difference of 0.27%), and Romanian (2.1%, a difference of 0.33%).
| Demographics | Rating | Rank | Single Father Households |
| Bhutanese | 99.5 /100 | #88 | Exceptional 2.1% |
| Immigrants | Armenia | 99.5 /100 | #89 | Exceptional 2.1% |
| Immigrants | Pakistan | 99.5 /100 | #90 | Exceptional 2.1% |
| Immigrants | Guyana | 99.4 /100 | #91 | Exceptional 2.1% |
| Romanians | 99.4 /100 | #92 | Exceptional 2.1% |
| Croatians | 99.3 /100 | #93 | Exceptional 2.1% |
| Ukrainians | 99.3 /100 | #94 | Exceptional 2.1% |
| Bermudans | 99.2 /100 | #95 | Exceptional 2.1% |
| Arabs | 99.2 /100 | #96 | Exceptional 2.1% |
| Immigrants | Moldova | 99.1 /100 | #97 | Exceptional 2.1% |
| Guyanese | 99.1 /100 | #98 | Exceptional 2.1% |
| South Africans | 99.1 /100 | #99 | Exceptional 2.1% |
| Immigrants | Northern Africa | 99.0 /100 | #100 | Exceptional 2.1% |
| Immigrants | Western Europe | 98.9 /100 | #101 | Exceptional 2.1% |
| Argentineans | 98.9 /100 | #102 | Exceptional 2.1% |