Dutch West Indian vs Yakama Family Households with Children

COMPARE

Dutch West Indian
Race
Ancestry
AfghanAfricanAlaska NativeAlaskan AthabascanAlbanianAleutAlsatianAmericanApacheArabArapahoArgentineanArmenianAssyrian/Chaldean/SyriacAustralianAustrianBahamianBangladeshiBarbadianBasqueBelgianBelizeanBermudanBhutaneseBlackfeetBolivianBrazilianBritishBritish West IndianBulgarianBurmeseCajunCambodianCanadianCape VerdeanCarpatho RusynCelticCentral AmericanCentral American IndianCherokeeCheyenneChickasawChileanChineseChippewaChoctawColombianColvilleComancheCosta RicanCreeCreekCroatianCrowCubanCypriotCzechCzechoslovakianDanishDelawareDominicanDutchDutch West IndianEastern EuropeanEcuadorianEgyptianEnglishEstonianEthiopianEuropeanFijianFilipinoFinnishFrenchFrench American IndianFrench CanadianGermanGerman RussianGhanaianGreekGuamanian/ChamorroGuatemalanGuyaneseHaitianHmongHonduranHopiHoumaHungarianIcelanderIndian (Asian)IndonesianInupiatIranianIraqiIrishIroquoisIsraeliItalianJamaicanJapaneseJordanianKenyanKiowaKoreanLaotianLatvianLebaneseLiberianLithuanianLumbeeLuxembourgerMacedonianMalaysianMalteseMarshalleseMenomineeMexicanMexican American IndianMongolianMoroccanNative HawaiianNavajoNepaleseNew ZealanderNicaraguanNigerianNorthern EuropeanNorwegianOkinawanOsageOttawaPaiutePakistaniPalestinianPanamanianParaguayanPennsylvania GermanPeruvianPimaPolishPortuguesePotawatomiPuebloPuerto RicanPuget Sound SalishRomanianRussianSalvadoranSamoanScandinavianScotch-IrishScottishSeminoleSenegaleseSerbianShoshoneSierra LeoneanSiouxSlavicSlovakSloveneSomaliSouth AfricanSouth AmericanSouth American IndianSoviet UnionSpaniardSpanishSpanish AmericanSpanish American IndianSri LankanSubsaharan AfricanSudaneseSwedishSwissSyrianTaiwaneseThaiTlingit-HaidaTohono O'OdhamTonganTrinidadian and TobagonianTsimshianTurkishU.S. Virgin IslanderUgandanUkrainianUruguayanUteVenezuelanVietnameseWelshWest IndianYaquiYugoslavianYumanYup'ikZimbabwean
Immigration
NonimmigrantsImmigrantsAfghanistanAfricaAlbaniaArgentinaArmeniaAsiaAustraliaAustriaBahamasBangladeshBarbadosBelarusBelgiumBelizeBoliviaBosnia and HerzegovinaBrazilBulgariaBurma/MyanmarCabo VerdeCambodiaCameroonCanadaCaribbeanCentral AmericaChileChinaColombiaCongoCosta RicaCroatiaCubaCzechoslovakiaDenmarkDominicaDominican RepublicEastern AfricaEastern AsiaEastern EuropeEcuadorEgyptEl SalvadorEnglandEritreaEthiopiaEuropeFijiFranceGermanyGhanaGreeceGrenadaGuatemalaGuyanaHaitiHondurasHong KongHungaryIndiaIndonesiaIranIraqIrelandIsraelItalyJamaicaJapanJordanKazakhstanKenyaKoreaKuwaitLaosLatin AmericaLatviaLebanonLiberiaLithuaniaMalaysiaMexicoMicronesiaMiddle AfricaMoldovaMoroccoNepalNetherlandsNicaraguaNigeriaNorth AmericaNorth MacedoniaNorthern AfricaNorthern EuropeNorwayOceaniaPakistanPanamaPeruPhilippinesPolandPortugalRomaniaRussiaSaudi ArabiaScotlandSenegalSerbiaSierra LeoneSingaporeSomaliaSouth AfricaSouth AmericaSouth Central AsiaSouth Eastern AsiaSouthern EuropeSpainSri LankaSt. Vincent and the GrenadinesSudanSwedenSwitzerlandSyriaTaiwanThailandTrinidad and TobagoTurkeyUgandaUkraineUruguayUzbekistanVenezuelaVietnamWest IndiesWestern AfricaWestern AsiaWestern EuropeYemenZaireZimbabweAzores
Yakama
Race
Ancestry
AfghanAfricanAlaska NativeAlaskan AthabascanAlbanianAleutAlsatianAmericanApacheArabArapahoArgentineanArmenianAssyrian/Chaldean/SyriacAustralianAustrianBahamianBangladeshiBarbadianBasqueBelgianBelizeanBermudanBhutaneseBlackfeetBolivianBrazilianBritishBritish West IndianBulgarianBurmeseCajunCambodianCanadianCape VerdeanCarpatho RusynCelticCentral AmericanCentral American IndianCherokeeCheyenneChickasawChileanChineseChippewaChoctawColombianColvilleComancheCosta RicanCreeCreekCroatianCrowCubanCypriotCzechCzechoslovakianDanishDelawareDominicanDutchEastern EuropeanEcuadorianEgyptianEnglishEstonianEthiopianEuropeanFijianFilipinoFinnishFrenchFrench American IndianFrench CanadianGermanGerman RussianGhanaianGreekGuamanian/ChamorroGuatemalanGuyaneseHaitianHmongHonduranHopiHoumaHungarianIcelanderIndian (Asian)IndonesianInupiatIranianIraqiIrishIroquoisIsraeliItalianJamaicanJapaneseJordanianKenyanKiowaKoreanLaotianLatvianLebaneseLiberianLithuanianLumbeeLuxembourgerMacedonianMalaysianMalteseMarshalleseMenomineeMexicanMexican American IndianMongolianMoroccanNative HawaiianNavajoNepaleseNew ZealanderNicaraguanNigerianNorthern EuropeanNorwegianOkinawanOsageOttawaPaiutePakistaniPalestinianPanamanianParaguayanPennsylvania GermanPeruvianPimaPolishPortuguesePotawatomiPuebloPuerto RicanPuget Sound SalishRomanianRussianSalvadoranSamoanScandinavianScotch-IrishScottishSeminoleSenegaleseSerbianShoshoneSierra LeoneanSiouxSlavicSlovakSloveneSomaliSouth AfricanSouth AmericanSouth American IndianSoviet UnionSpaniardSpanishSpanish AmericanSpanish American IndianSri LankanSubsaharan AfricanSudaneseSwedishSwissSyrianTaiwaneseThaiTlingit-HaidaTohono O'OdhamTonganTrinidadian and TobagonianTsimshianTurkishU.S. Virgin IslanderUgandanUkrainianUruguayanUteVenezuelanVietnameseWelshWest IndianYakamaYaquiYugoslavianYumanYup'ikZimbabwean
Immigration
NonimmigrantsImmigrantsAfghanistanAfricaAlbaniaArgentinaArmeniaAsiaAustraliaAustriaBahamasBangladeshBarbadosBelarusBelgiumBelizeBoliviaBosnia and HerzegovinaBrazilBulgariaBurma/MyanmarCabo VerdeCambodiaCameroonCanadaCaribbeanCentral AmericaChileChinaColombiaCongoCosta RicaCroatiaCubaCzechoslovakiaDenmarkDominicaDominican RepublicEastern AfricaEastern AsiaEastern EuropeEcuadorEgyptEl SalvadorEnglandEritreaEthiopiaEuropeFijiFranceGermanyGhanaGreeceGrenadaGuatemalaGuyanaHaitiHondurasHong KongHungaryIndiaIndonesiaIranIraqIrelandIsraelItalyJamaicaJapanJordanKazakhstanKenyaKoreaKuwaitLaosLatin AmericaLatviaLebanonLiberiaLithuaniaMalaysiaMexicoMicronesiaMiddle AfricaMoldovaMoroccoNepalNetherlandsNicaraguaNigeriaNorth AmericaNorth MacedoniaNorthern AfricaNorthern EuropeNorwayOceaniaPakistanPanamaPeruPhilippinesPolandPortugalRomaniaRussiaSaudi ArabiaScotlandSenegalSerbiaSierra LeoneSingaporeSomaliaSouth AfricaSouth AmericaSouth Central AsiaSouth Eastern AsiaSouthern EuropeSpainSri LankaSt. Vincent and the GrenadinesSudanSwedenSwitzerlandSyriaTaiwanThailandTrinidad and TobagoTurkeyUgandaUkraineUruguayUzbekistanVenezuelaVietnamWest IndiesWestern AfricaWestern AsiaWestern EuropeYemenZaireZimbabweAzores
Family Households with Children
Income
Poverty
Unemployment
Labor Participation
Family Structure
Vehicle Availability
Education Level
Disability

Family Households with Children Comparison

Dutch West Indians

Yakama

Poor
Exceptional
27.2%
FAMILY HOUSEHOLDS WITH CHILDREN
15.8/ 100
METRIC RATING
209th/ 347
METRIC RANK
30.8%
FAMILY HOUSEHOLDS WITH CHILDREN
100.0/ 100
METRIC RATING
8th/ 347
METRIC RANK

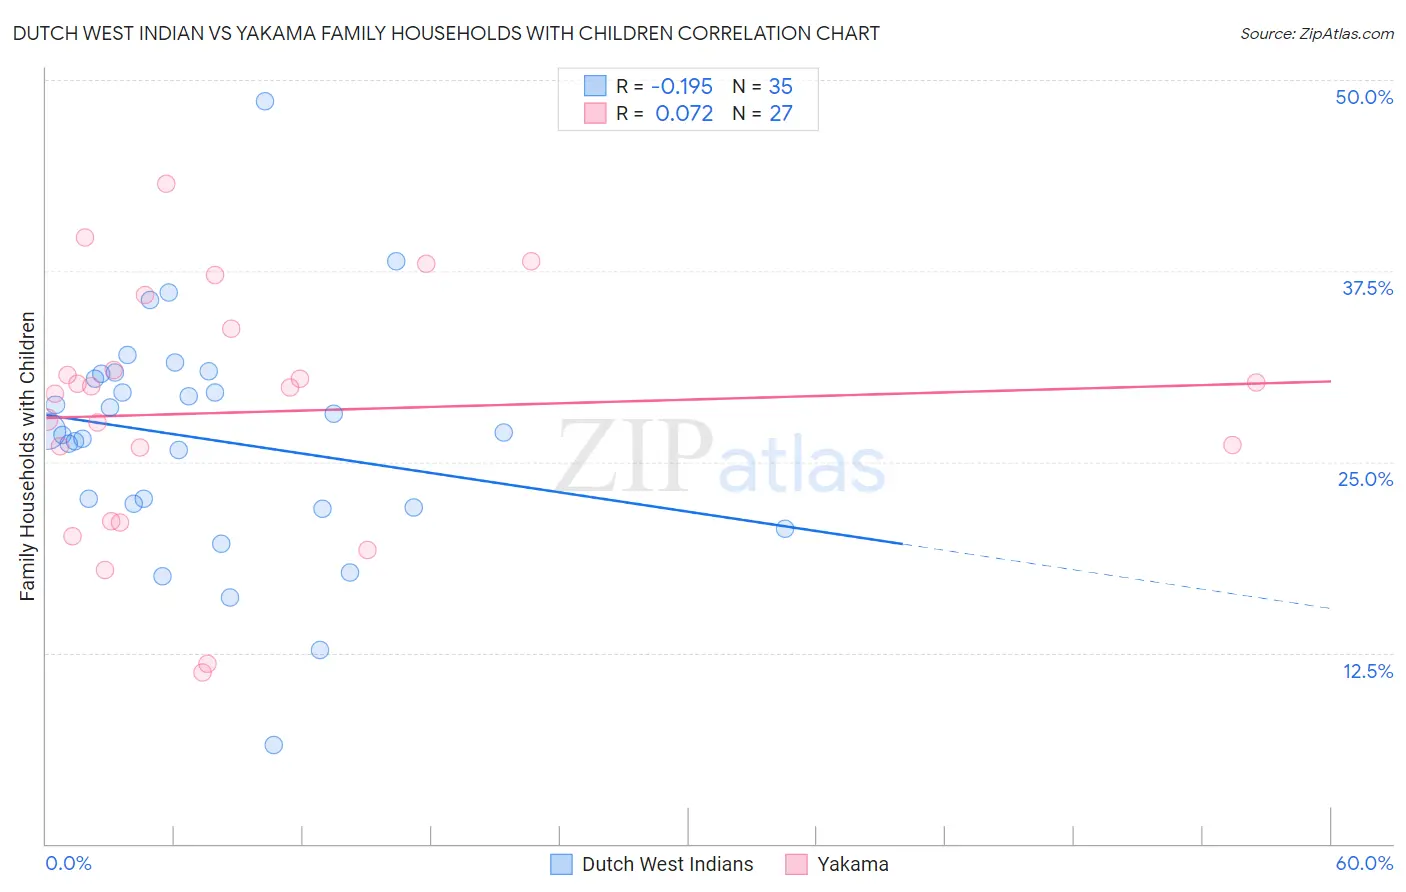
Dutch West Indian vs Yakama Family Households with Children Correlation Chart

The statistical analysis conducted on geographies consisting of 85,765,288 people shows a poor negative correlation between the proportion of Dutch West Indians and percentage of family households with children in the United States with a correlation coefficient (R) of -0.195 and weighted average of 27.2%. Similarly, the statistical analysis conducted on geographies consisting of 19,917,879 people shows a slight positive correlation between the proportion of Yakama and percentage of family households with children in the United States with a correlation coefficient (R) of 0.072 and weighted average of 30.8%, a difference of 13.2%.
Dutch West Indian vs Yakama Family Households with Children

Family Households with Children Correlation Summary

MeasurementDutch West IndianYakama
Minimum6.5%11.2%
Maximum48.6%43.2%
Range42.2%32.0%
Mean26.5%28.3%
Median26.9%29.9%
Interquartile 25% (IQ1)22.0%21.1%
Interquartile 75% (IQ3)30.8%33.7%
Interquartile Range (IQR)8.7%12.6%
Standard Deviation (Sample)7.7%8.0%
Standard Deviation (Population)7.5%7.9%

Similar Demographics by Family Households with Children

Demographics Similar to Dutch West Indians by Family Households with Children

In terms of family households with children, the demographic groups most similar to Dutch West Indians are Immigrants from Poland (27.2%, a difference of 0.030%), Immigrants from Ukraine (27.2%, a difference of 0.060%), Welsh (27.2%, a difference of 0.070%), Immigrants from Dominica (27.2%, a difference of 0.080%), and Okinawan (27.2%, a difference of 0.090%).
DemographicsRating | RankFamily Households with Children
Americans
22.8
/100
|
#202
Fair
27.3%
Kiowa
22.2
/100
|
#203
Fair
27.3%
Immigrants | Sudan
21.6
/100
|
#204
Fair
27.3%
Immigrants | Haiti
20.3
/100
|
#205
Fair
27.2%
Immigrants | Micronesia
20.2
/100
|
#206
Fair
27.2%
Haitians
19.8
/100
|
#207
Poor
27.2%
Immigrants | Poland
16.4
/100
|
#208
Poor
27.2%
Dutch West Indians
15.8
/100
|
#209
Poor
27.2%
Immigrants | Ukraine
14.4
/100
|
#210
Poor
27.2%
Welsh
14.2
/100
|
#211
Poor
27.2%
Immigrants | Dominica
13.9
/100
|
#212
Poor
27.2%
Okinawans
13.7
/100
|
#213
Poor
27.2%
Africans
13.0
/100
|
#214
Poor
27.2%
Northern Europeans
12.8
/100
|
#215
Poor
27.2%
Cubans
12.2
/100
|
#216
Poor
27.1%

Demographics Similar to Yakama by Family Households with Children

In terms of family households with children, the demographic groups most similar to Yakama are Thai (30.6%, a difference of 0.48%), Immigrants from Central America (31.0%, a difference of 0.57%), Immigrants from Fiji (30.5%, a difference of 0.80%), Immigrants from India (31.0%, a difference of 0.87%), and Nepalese (30.5%, a difference of 0.88%).
DemographicsRating | RankFamily Households with Children
Yup'ik
100
/100
|
#1
Exceptional
37.0%
Inupiat
100
/100
|
#2
Exceptional
32.8%
Immigrants | Mexico
100.0
/100
|
#3
Exceptional
31.6%
Mexicans
100.0
/100
|
#4
Exceptional
31.4%
Tongans
100.0
/100
|
#5
Exceptional
31.2%
Immigrants | India
100.0
/100
|
#6
Exceptional
31.0%
Immigrants | Central America
100.0
/100
|
#7
Exceptional
31.0%
Yakama
100.0
/100
|
#8
Exceptional
30.8%
Thais
100.0
/100
|
#9
Exceptional
30.6%
Immigrants | Fiji
100.0
/100
|
#10
Exceptional
30.5%
Nepalese
100.0
/100
|
#11
Exceptional
30.5%
Immigrants | Pakistan
100.0
/100
|
#12
Exceptional
30.2%
Afghans
100.0
/100
|
#13
Exceptional
30.2%
Bangladeshis
100.0
/100
|
#14
Exceptional
30.1%
Immigrants | South Central Asia
100.0
/100
|
#15
Exceptional
30.0%