Native/Alaskan vs Immigrants from India Single Father Households
COMPARE
Native/Alaskan
Immigrants from India
Single Father Households
Single Father Households Comparison
Natives/Alaskans
Immigrants from India
3.2%
SINGLE FATHER HOUSEHOLDS
0.0/ 100
METRIC RATING
333rd/ 347
METRIC RANK
1.9%
SINGLE FATHER HOUSEHOLDS
100.0/ 100
METRIC RATING
17th/ 347
METRIC RANK
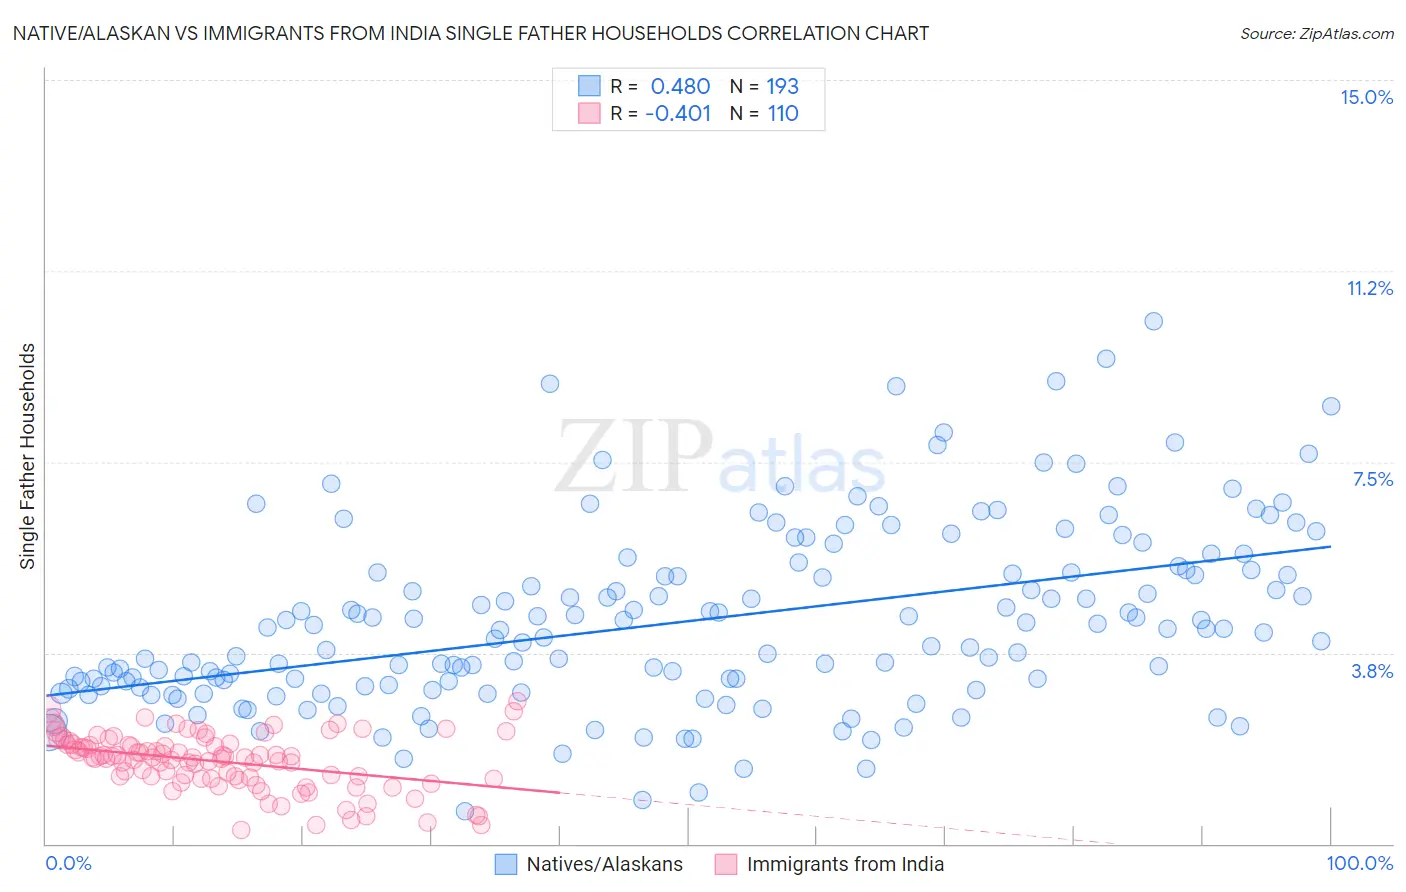
Native/Alaskan vs Immigrants from India Single Father Households Correlation Chart
The statistical analysis conducted on geographies consisting of 505,226,319 people shows a moderate positive correlation between the proportion of Natives/Alaskans and percentage of single father households in the United States with a correlation coefficient (R) of 0.480 and weighted average of 3.2%. Similarly, the statistical analysis conducted on geographies consisting of 429,563,662 people shows a moderate negative correlation between the proportion of Immigrants from India and percentage of single father households in the United States with a correlation coefficient (R) of -0.401 and weighted average of 1.9%, a difference of 69.1%.
Single Father Households Correlation Summary
| Measurement | Native/Alaskan | Immigrants from India |
| Minimum | 0.64% | 0.27% |
| Maximum | 10.3% | 2.8% |
| Range | 9.6% | 2.5% |
| Mean | 4.4% | 1.6% |
| Median | 4.1% | 1.7% |
| Interquartile 25% (IQ1) | 3.1% | 1.3% |
| Interquartile 75% (IQ3) | 5.4% | 2.0% |
| Interquartile Range (IQR) | 2.3% | 0.67% |
| Standard Deviation (Sample) | 1.8% | 0.55% |
| Standard Deviation (Population) | 1.8% | 0.54% |
Similar Demographics by Single Father Households
Demographics Similar to Natives/Alaskans by Single Father Households
In terms of single father households, the demographic groups most similar to Natives/Alaskans are Yaqui (3.2%, a difference of 0.49%), Navajo (3.2%, a difference of 0.54%), Yuman (3.3%, a difference of 2.8%), Colville (3.3%, a difference of 2.8%), and Paiute (3.3%, a difference of 2.8%).
| Demographics | Rating | Rank | Single Father Households |
| Aleuts | 0.0 /100 | #326 | Tragic 3.0% |
| Bangladeshis | 0.0 /100 | #327 | Tragic 3.1% |
| Immigrants | Cabo Verde | 0.0 /100 | #328 | Tragic 3.1% |
| Chippewa | 0.0 /100 | #329 | Tragic 3.1% |
| Nepalese | 0.0 /100 | #330 | Tragic 3.1% |
| Navajo | 0.0 /100 | #331 | Tragic 3.2% |
| Yaqui | 0.0 /100 | #332 | Tragic 3.2% |
| Natives/Alaskans | 0.0 /100 | #333 | Tragic 3.2% |
| Yuman | 0.0 /100 | #334 | Tragic 3.3% |
| Colville | 0.0 /100 | #335 | Tragic 3.3% |
| Paiute | 0.0 /100 | #336 | Tragic 3.3% |
| Pueblo | 0.0 /100 | #337 | Tragic 3.3% |
| Sioux | 0.0 /100 | #338 | Tragic 3.3% |
| Alaskan Athabascans | 0.0 /100 | #339 | Tragic 3.4% |
| Alaska Natives | 0.0 /100 | #340 | Tragic 3.5% |
Demographics Similar to Immigrants from India by Single Father Households
In terms of single father households, the demographic groups most similar to Immigrants from India are Immigrants from Iran (1.9%, a difference of 0.23%), Immigrants from Eastern Asia (1.9%, a difference of 0.43%), Indian (Asian) (1.9%, a difference of 0.50%), Immigrants from Lithuania (1.9%, a difference of 0.58%), and Iranian (1.9%, a difference of 1.3%).
| Demographics | Rating | Rank | Single Father Households |
| Okinawans | 100.0 /100 | #10 | Exceptional 1.9% |
| Immigrants | Belarus | 100.0 /100 | #11 | Exceptional 1.9% |
| Immigrants | Greece | 100.0 /100 | #12 | Exceptional 1.9% |
| Immigrants | Singapore | 100.0 /100 | #13 | Exceptional 1.9% |
| Immigrants | Lithuania | 100.0 /100 | #14 | Exceptional 1.9% |
| Immigrants | Eastern Asia | 100.0 /100 | #15 | Exceptional 1.9% |
| Immigrants | Iran | 100.0 /100 | #16 | Exceptional 1.9% |
| Immigrants | India | 100.0 /100 | #17 | Exceptional 1.9% |
| Indians (Asian) | 100.0 /100 | #18 | Exceptional 1.9% |
| Iranians | 100.0 /100 | #19 | Exceptional 1.9% |
| Thais | 100.0 /100 | #20 | Exceptional 1.9% |
| Immigrants | Albania | 100.0 /100 | #21 | Exceptional 1.9% |
| Immigrants | Latvia | 100.0 /100 | #22 | Exceptional 1.9% |
| Immigrants | Croatia | 100.0 /100 | #23 | Exceptional 2.0% |
| Immigrants | Russia | 100.0 /100 | #24 | Exceptional 2.0% |