Icelander vs Immigrants from India Single Father Households
COMPARE
Icelander
Immigrants from India
Single Father Households
Single Father Households Comparison
Icelanders
Immigrants from India
2.3%
SINGLE FATHER HOUSEHOLDS
63.1/ 100
METRIC RATING
168th/ 347
METRIC RANK
1.9%
SINGLE FATHER HOUSEHOLDS
100.0/ 100
METRIC RATING
17th/ 347
METRIC RANK
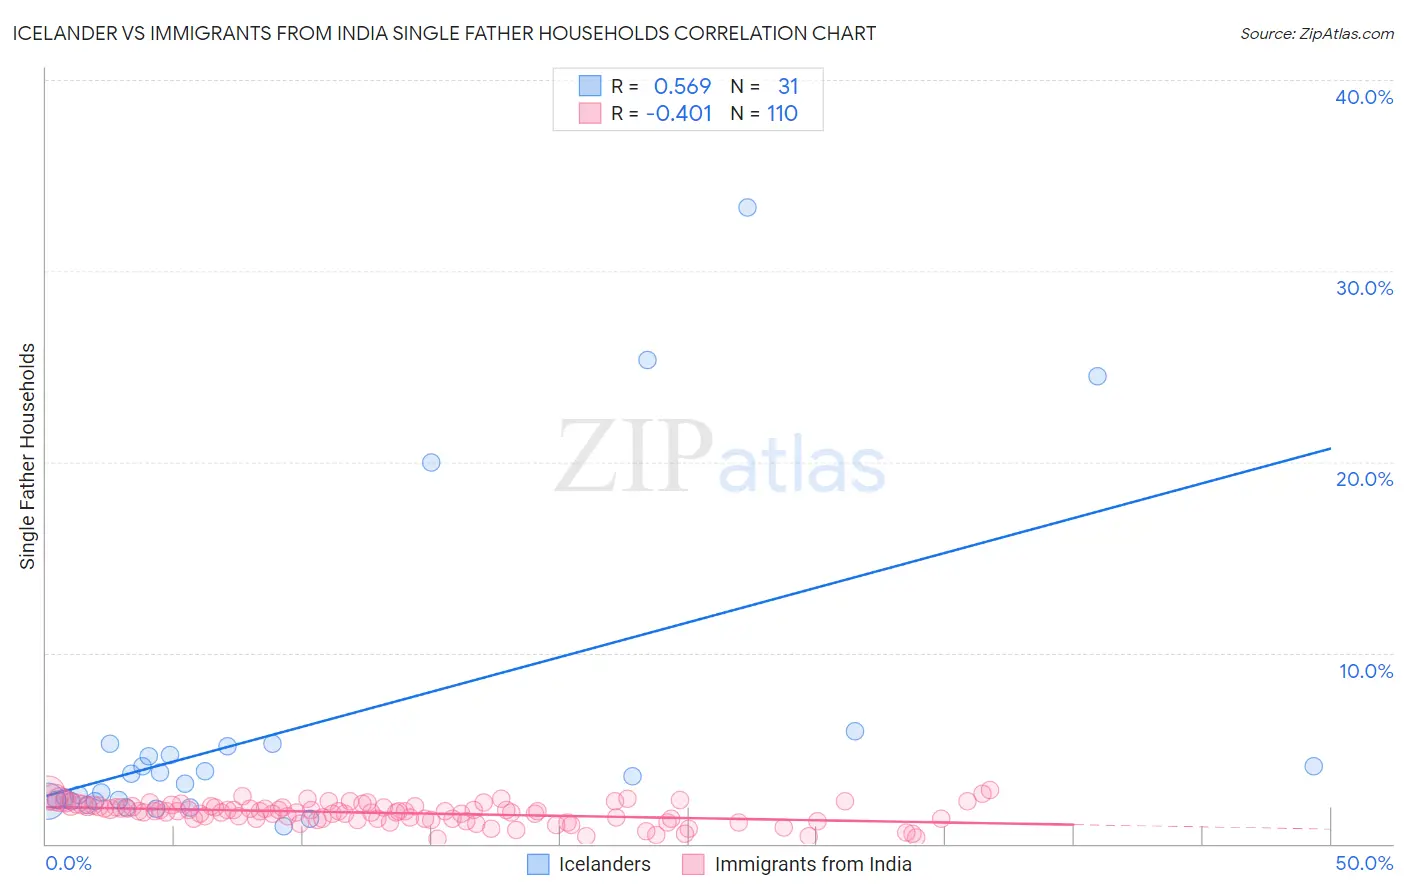
Icelander vs Immigrants from India Single Father Households Correlation Chart
The statistical analysis conducted on geographies consisting of 159,015,107 people shows a substantial positive correlation between the proportion of Icelanders and percentage of single father households in the United States with a correlation coefficient (R) of 0.569 and weighted average of 2.3%. Similarly, the statistical analysis conducted on geographies consisting of 429,563,662 people shows a moderate negative correlation between the proportion of Immigrants from India and percentage of single father households in the United States with a correlation coefficient (R) of -0.401 and weighted average of 1.9%, a difference of 22.1%.
Single Father Households Correlation Summary
| Measurement | Icelander | Immigrants from India |
| Minimum | 0.94% | 0.27% |
| Maximum | 33.3% | 2.8% |
| Range | 32.4% | 2.5% |
| Mean | 6.1% | 1.6% |
| Median | 3.5% | 1.7% |
| Interquartile 25% (IQ1) | 2.2% | 1.3% |
| Interquartile 75% (IQ3) | 5.1% | 2.0% |
| Interquartile Range (IQR) | 2.9% | 0.67% |
| Standard Deviation (Sample) | 8.0% | 0.55% |
| Standard Deviation (Population) | 7.9% | 0.54% |
Similar Demographics by Single Father Households
Demographics Similar to Icelanders by Single Father Households
In terms of single father households, the demographic groups most similar to Icelanders are Czech (2.3%, a difference of 0.040%), Ugandan (2.3%, a difference of 0.070%), South American (2.3%, a difference of 0.10%), Swedish (2.3%, a difference of 0.12%), and Czechoslovakian (2.3%, a difference of 0.33%).
| Demographics | Rating | Rank | Single Father Households |
| Swiss | 73.2 /100 | #161 | Good 2.3% |
| Scottish | 72.8 /100 | #162 | Good 2.3% |
| Irish | 72.1 /100 | #163 | Good 2.3% |
| Pakistanis | 70.6 /100 | #164 | Good 2.3% |
| Scotch-Irish | 69.4 /100 | #165 | Good 2.3% |
| English | 68.6 /100 | #166 | Good 2.3% |
| South Americans | 64.3 /100 | #167 | Good 2.3% |
| Icelanders | 63.1 /100 | #168 | Good 2.3% |
| Czechs | 62.5 /100 | #169 | Good 2.3% |
| Ugandans | 62.2 /100 | #170 | Good 2.3% |
| Swedes | 61.6 /100 | #171 | Good 2.3% |
| Czechoslovakians | 58.9 /100 | #172 | Average 2.3% |
| Celtics | 55.4 /100 | #173 | Average 2.3% |
| Afghans | 50.0 /100 | #174 | Average 2.3% |
| Immigrants | Jamaica | 49.1 /100 | #175 | Average 2.3% |
Demographics Similar to Immigrants from India by Single Father Households
In terms of single father households, the demographic groups most similar to Immigrants from India are Immigrants from Iran (1.9%, a difference of 0.23%), Immigrants from Eastern Asia (1.9%, a difference of 0.43%), Indian (Asian) (1.9%, a difference of 0.50%), Immigrants from Lithuania (1.9%, a difference of 0.58%), and Iranian (1.9%, a difference of 1.3%).
| Demographics | Rating | Rank | Single Father Households |
| Okinawans | 100.0 /100 | #10 | Exceptional 1.9% |
| Immigrants | Belarus | 100.0 /100 | #11 | Exceptional 1.9% |
| Immigrants | Greece | 100.0 /100 | #12 | Exceptional 1.9% |
| Immigrants | Singapore | 100.0 /100 | #13 | Exceptional 1.9% |
| Immigrants | Lithuania | 100.0 /100 | #14 | Exceptional 1.9% |
| Immigrants | Eastern Asia | 100.0 /100 | #15 | Exceptional 1.9% |
| Immigrants | Iran | 100.0 /100 | #16 | Exceptional 1.9% |
| Immigrants | India | 100.0 /100 | #17 | Exceptional 1.9% |
| Indians (Asian) | 100.0 /100 | #18 | Exceptional 1.9% |
| Iranians | 100.0 /100 | #19 | Exceptional 1.9% |
| Thais | 100.0 /100 | #20 | Exceptional 1.9% |
| Immigrants | Albania | 100.0 /100 | #21 | Exceptional 1.9% |
| Immigrants | Latvia | 100.0 /100 | #22 | Exceptional 1.9% |
| Immigrants | Croatia | 100.0 /100 | #23 | Exceptional 2.0% |
| Immigrants | Russia | 100.0 /100 | #24 | Exceptional 2.0% |