Native/Alaskan vs Puerto Rican Single Father Households
COMPARE
Native/Alaskan
Puerto Rican
Single Father Households
Single Father Households Comparison
Natives/Alaskans
Puerto Ricans
3.2%
SINGLE FATHER HOUSEHOLDS
0.0/ 100
METRIC RATING
333rd/ 347
METRIC RANK
2.6%
SINGLE FATHER HOUSEHOLDS
0.2/ 100
METRIC RATING
274th/ 347
METRIC RANK
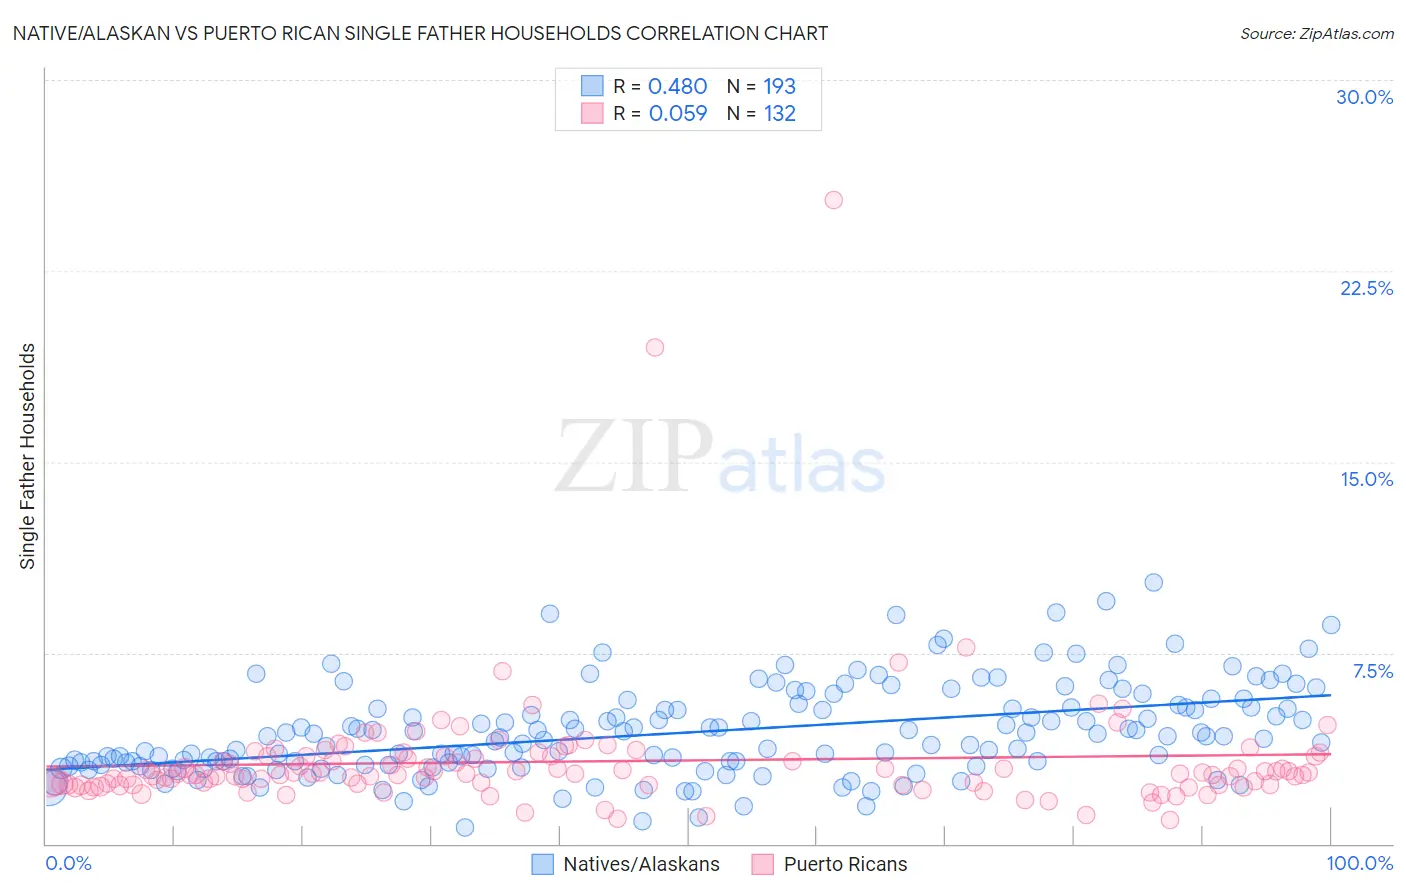
Native/Alaskan vs Puerto Rican Single Father Households Correlation Chart
The statistical analysis conducted on geographies consisting of 505,226,319 people shows a moderate positive correlation between the proportion of Natives/Alaskans and percentage of single father households in the United States with a correlation coefficient (R) of 0.480 and weighted average of 3.2%. Similarly, the statistical analysis conducted on geographies consisting of 519,503,962 people shows a slight positive correlation between the proportion of Puerto Ricans and percentage of single father households in the United States with a correlation coefficient (R) of 0.059 and weighted average of 2.6%, a difference of 23.1%.
Single Father Households Correlation Summary
| Measurement | Native/Alaskan | Puerto Rican |
| Minimum | 0.64% | 0.92% |
| Maximum | 10.3% | 25.3% |
| Range | 9.6% | 24.4% |
| Mean | 4.4% | 3.2% |
| Median | 4.1% | 2.7% |
| Interquartile 25% (IQ1) | 3.1% | 2.3% |
| Interquartile 75% (IQ3) | 5.4% | 3.5% |
| Interquartile Range (IQR) | 2.3% | 1.1% |
| Standard Deviation (Sample) | 1.8% | 2.6% |
| Standard Deviation (Population) | 1.8% | 2.6% |
Similar Demographics by Single Father Households
Demographics Similar to Natives/Alaskans by Single Father Households
In terms of single father households, the demographic groups most similar to Natives/Alaskans are Yaqui (3.2%, a difference of 0.49%), Navajo (3.2%, a difference of 0.54%), Yuman (3.3%, a difference of 2.8%), Colville (3.3%, a difference of 2.8%), and Paiute (3.3%, a difference of 2.8%).
| Demographics | Rating | Rank | Single Father Households |
| Aleuts | 0.0 /100 | #326 | Tragic 3.0% |
| Bangladeshis | 0.0 /100 | #327 | Tragic 3.1% |
| Immigrants | Cabo Verde | 0.0 /100 | #328 | Tragic 3.1% |
| Chippewa | 0.0 /100 | #329 | Tragic 3.1% |
| Nepalese | 0.0 /100 | #330 | Tragic 3.1% |
| Navajo | 0.0 /100 | #331 | Tragic 3.2% |
| Yaqui | 0.0 /100 | #332 | Tragic 3.2% |
| Natives/Alaskans | 0.0 /100 | #333 | Tragic 3.2% |
| Yuman | 0.0 /100 | #334 | Tragic 3.3% |
| Colville | 0.0 /100 | #335 | Tragic 3.3% |
| Paiute | 0.0 /100 | #336 | Tragic 3.3% |
| Pueblo | 0.0 /100 | #337 | Tragic 3.3% |
| Sioux | 0.0 /100 | #338 | Tragic 3.3% |
| Alaskan Athabascans | 0.0 /100 | #339 | Tragic 3.4% |
| Alaska Natives | 0.0 /100 | #340 | Tragic 3.5% |
Demographics Similar to Puerto Ricans by Single Father Households
In terms of single father households, the demographic groups most similar to Puerto Ricans are Iroquois (2.6%, a difference of 0.030%), Creek (2.6%, a difference of 0.070%), Belizean (2.6%, a difference of 0.070%), Immigrants from Dominican Republic (2.6%, a difference of 0.42%), and Seminole (2.6%, a difference of 0.44%).
| Demographics | Rating | Rank | Single Father Households |
| Guamanians/Chamorros | 0.4 /100 | #267 | Tragic 2.6% |
| Haitians | 0.4 /100 | #268 | Tragic 2.6% |
| Cubans | 0.3 /100 | #269 | Tragic 2.6% |
| Seminole | 0.3 /100 | #270 | Tragic 2.6% |
| Creek | 0.2 /100 | #271 | Tragic 2.6% |
| Belizeans | 0.2 /100 | #272 | Tragic 2.6% |
| Iroquois | 0.2 /100 | #273 | Tragic 2.6% |
| Puerto Ricans | 0.2 /100 | #274 | Tragic 2.6% |
| Immigrants | Dominican Republic | 0.2 /100 | #275 | Tragic 2.6% |
| Immigrants | Haiti | 0.1 /100 | #276 | Tragic 2.6% |
| Shoshone | 0.1 /100 | #277 | Tragic 2.6% |
| Cherokee | 0.1 /100 | #278 | Tragic 2.6% |
| Samoans | 0.1 /100 | #279 | Tragic 2.6% |
| Immigrants | Portugal | 0.1 /100 | #280 | Tragic 2.6% |
| Nicaraguans | 0.1 /100 | #281 | Tragic 2.6% |