Native/Alaskan vs Immigrants from Syria Single Father Households
COMPARE
Native/Alaskan
Immigrants from Syria
Single Father Households
Single Father Households Comparison
Natives/Alaskans
Immigrants from Syria
3.2%
SINGLE FATHER HOUSEHOLDS
0.0/ 100
METRIC RATING
333rd/ 347
METRIC RANK
2.3%
SINGLE FATHER HOUSEHOLDS
84.8/ 100
METRIC RATING
151st/ 347
METRIC RANK
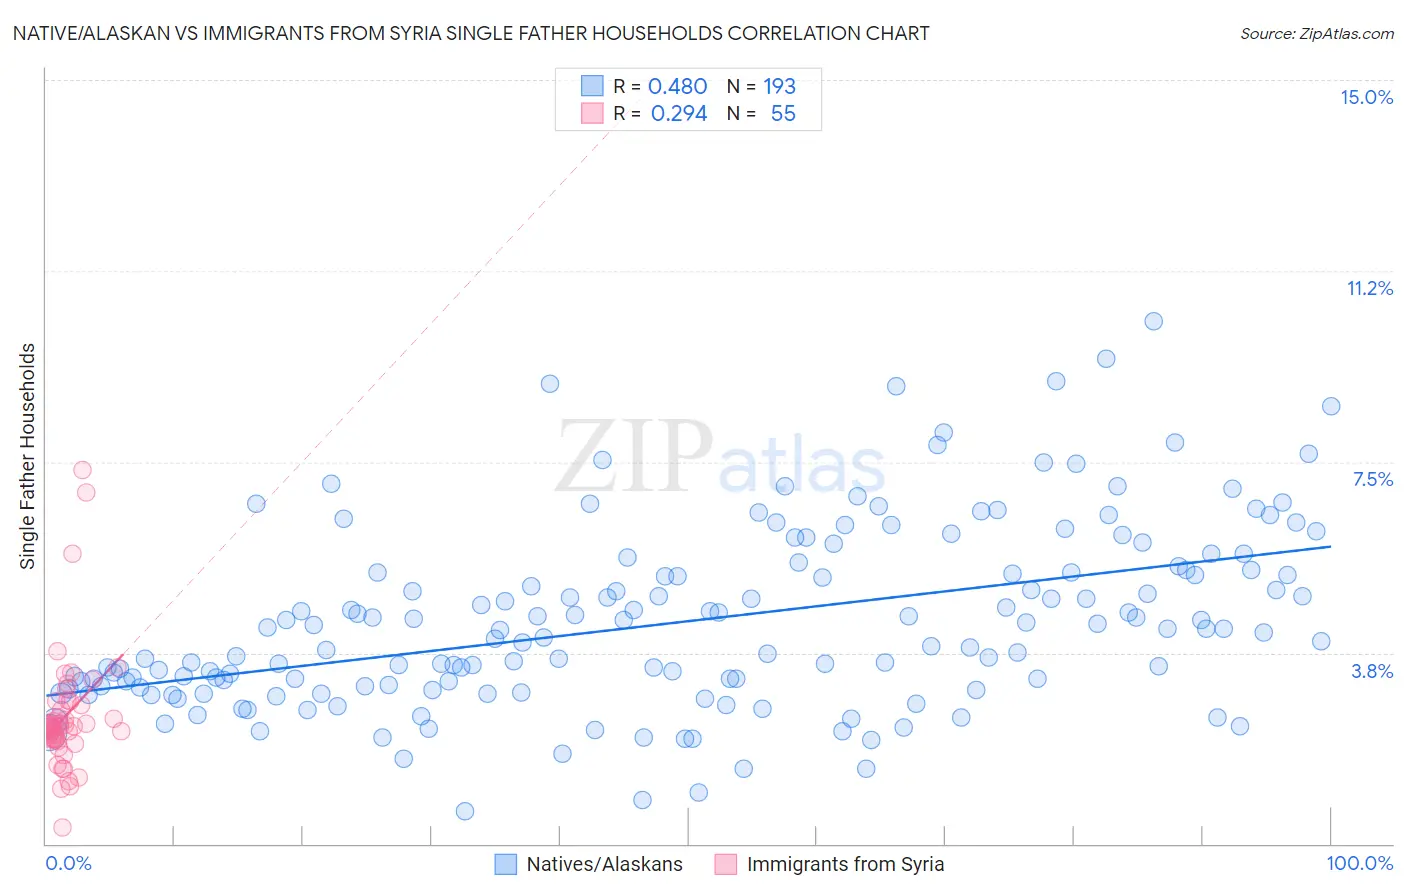
Native/Alaskan vs Immigrants from Syria Single Father Households Correlation Chart
The statistical analysis conducted on geographies consisting of 505,226,319 people shows a moderate positive correlation between the proportion of Natives/Alaskans and percentage of single father households in the United States with a correlation coefficient (R) of 0.480 and weighted average of 3.2%. Similarly, the statistical analysis conducted on geographies consisting of 173,690,460 people shows a weak positive correlation between the proportion of Immigrants from Syria and percentage of single father households in the United States with a correlation coefficient (R) of 0.294 and weighted average of 2.3%, a difference of 41.6%.
Single Father Households Correlation Summary
| Measurement | Native/Alaskan | Immigrants from Syria |
| Minimum | 0.64% | 0.32% |
| Maximum | 10.3% | 7.3% |
| Range | 9.6% | 7.0% |
| Mean | 4.4% | 2.5% |
| Median | 4.1% | 2.3% |
| Interquartile 25% (IQ1) | 3.1% | 2.1% |
| Interquartile 75% (IQ3) | 5.4% | 2.7% |
| Interquartile Range (IQR) | 2.3% | 0.66% |
| Standard Deviation (Sample) | 1.8% | 1.2% |
| Standard Deviation (Population) | 1.8% | 1.2% |
Similar Demographics by Single Father Households
Demographics Similar to Natives/Alaskans by Single Father Households
In terms of single father households, the demographic groups most similar to Natives/Alaskans are Yaqui (3.2%, a difference of 0.49%), Navajo (3.2%, a difference of 0.54%), Yuman (3.3%, a difference of 2.8%), Colville (3.3%, a difference of 2.8%), and Paiute (3.3%, a difference of 2.8%).
| Demographics | Rating | Rank | Single Father Households |
| Aleuts | 0.0 /100 | #326 | Tragic 3.0% |
| Bangladeshis | 0.0 /100 | #327 | Tragic 3.1% |
| Immigrants | Cabo Verde | 0.0 /100 | #328 | Tragic 3.1% |
| Chippewa | 0.0 /100 | #329 | Tragic 3.1% |
| Nepalese | 0.0 /100 | #330 | Tragic 3.1% |
| Navajo | 0.0 /100 | #331 | Tragic 3.2% |
| Yaqui | 0.0 /100 | #332 | Tragic 3.2% |
| Natives/Alaskans | 0.0 /100 | #333 | Tragic 3.2% |
| Yuman | 0.0 /100 | #334 | Tragic 3.3% |
| Colville | 0.0 /100 | #335 | Tragic 3.3% |
| Paiute | 0.0 /100 | #336 | Tragic 3.3% |
| Pueblo | 0.0 /100 | #337 | Tragic 3.3% |
| Sioux | 0.0 /100 | #338 | Tragic 3.3% |
| Alaskan Athabascans | 0.0 /100 | #339 | Tragic 3.4% |
| Alaska Natives | 0.0 /100 | #340 | Tragic 3.5% |
Demographics Similar to Immigrants from Syria by Single Father Households
In terms of single father households, the demographic groups most similar to Immigrants from Syria are Venezuelan (2.3%, a difference of 0.21%), Immigrants from Venezuela (2.3%, a difference of 0.23%), Immigrants from Germany (2.3%, a difference of 0.28%), Bolivian (2.3%, a difference of 0.51%), and European (2.3%, a difference of 0.52%).
| Demographics | Rating | Rank | Single Father Households |
| Slovaks | 90.7 /100 | #144 | Exceptional 2.2% |
| Immigrants | Zimbabwe | 90.2 /100 | #145 | Exceptional 2.2% |
| Northern Europeans | 89.8 /100 | #146 | Excellent 2.2% |
| Slavs | 88.9 /100 | #147 | Excellent 2.2% |
| South American Indians | 88.5 /100 | #148 | Excellent 2.3% |
| Senegalese | 88.4 /100 | #149 | Excellent 2.3% |
| Venezuelans | 86.2 /100 | #150 | Excellent 2.3% |
| Immigrants | Syria | 84.8 /100 | #151 | Excellent 2.3% |
| Immigrants | Venezuela | 83.2 /100 | #152 | Excellent 2.3% |
| Immigrants | Germany | 82.8 /100 | #153 | Excellent 2.3% |
| Bolivians | 81.0 /100 | #154 | Excellent 2.3% |
| Europeans | 80.9 /100 | #155 | Excellent 2.3% |
| Immigrants | South America | 79.9 /100 | #156 | Good 2.3% |
| Canadians | 79.7 /100 | #157 | Good 2.3% |
| Immigrants | Senegal | 79.4 /100 | #158 | Good 2.3% |