Alaska Native vs Immigrants from India Single Father Households
COMPARE
Alaska Native
Immigrants from India
Single Father Households
Single Father Households Comparison
Alaska Natives
Immigrants from India
3.5%
SINGLE FATHER HOUSEHOLDS
0.0/ 100
METRIC RATING
340th/ 347
METRIC RANK
1.9%
SINGLE FATHER HOUSEHOLDS
100.0/ 100
METRIC RATING
17th/ 347
METRIC RANK
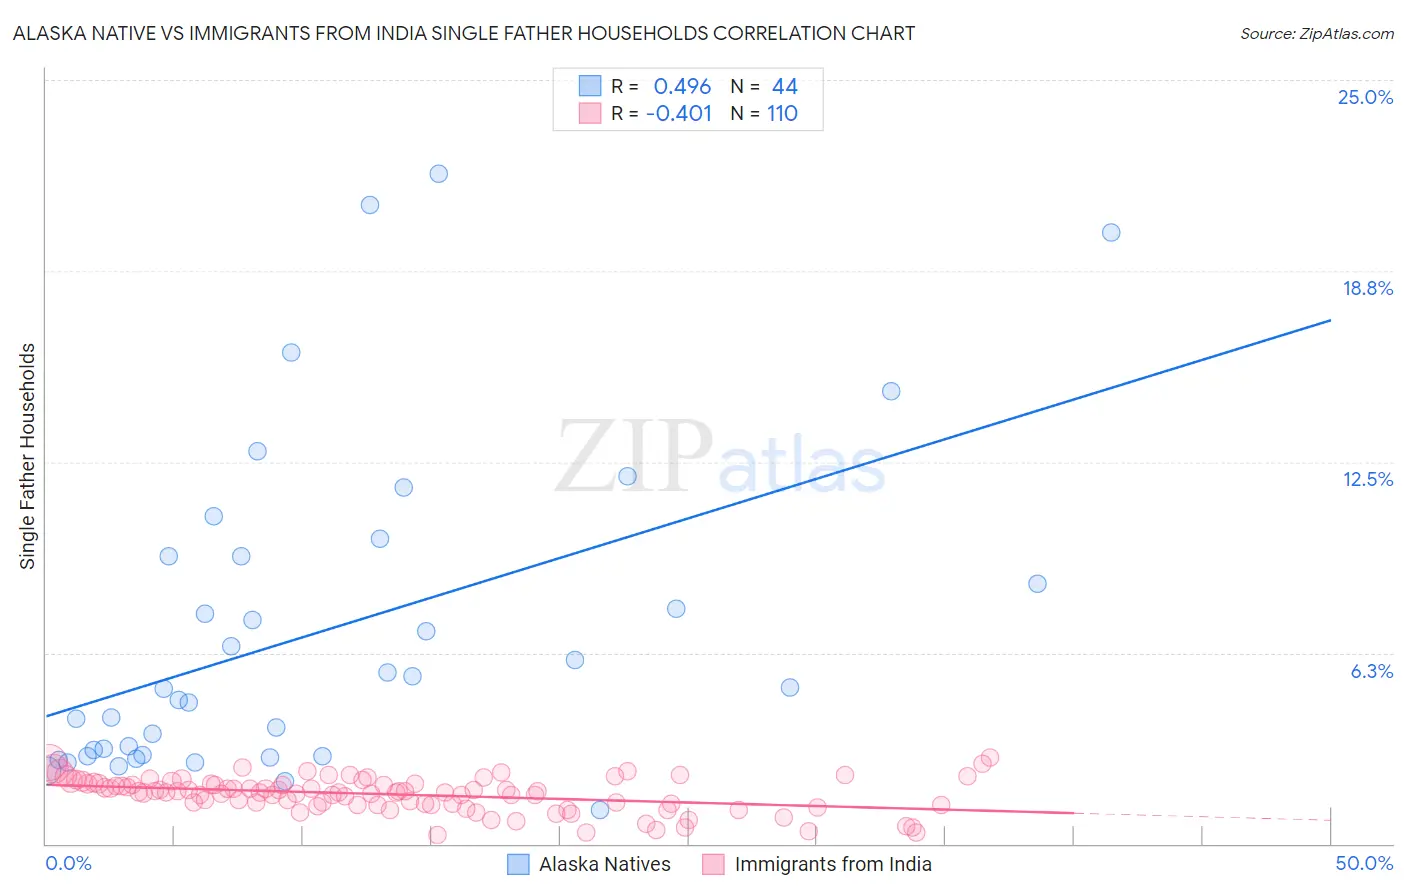
Alaska Native vs Immigrants from India Single Father Households Correlation Chart
The statistical analysis conducted on geographies consisting of 76,608,440 people shows a moderate positive correlation between the proportion of Alaska Natives and percentage of single father households in the United States with a correlation coefficient (R) of 0.496 and weighted average of 3.5%. Similarly, the statistical analysis conducted on geographies consisting of 429,563,662 people shows a moderate negative correlation between the proportion of Immigrants from India and percentage of single father households in the United States with a correlation coefficient (R) of -0.401 and weighted average of 1.9%, a difference of 84.7%.
Single Father Households Correlation Summary
| Measurement | Alaska Native | Immigrants from India |
| Minimum | 1.1% | 0.27% |
| Maximum | 21.9% | 2.8% |
| Range | 20.8% | 2.5% |
| Mean | 7.0% | 1.6% |
| Median | 5.1% | 1.7% |
| Interquartile 25% (IQ1) | 2.9% | 1.3% |
| Interquartile 75% (IQ3) | 9.4% | 2.0% |
| Interquartile Range (IQR) | 6.5% | 0.67% |
| Standard Deviation (Sample) | 5.3% | 0.55% |
| Standard Deviation (Population) | 5.2% | 0.54% |
Similar Demographics by Single Father Households
Demographics Similar to Alaska Natives by Single Father Households
In terms of single father households, the demographic groups most similar to Alaska Natives are Crow (3.5%, a difference of 0.35%), Alaskan Athabascan (3.4%, a difference of 3.8%), Sioux (3.3%, a difference of 5.3%), Pueblo (3.3%, a difference of 6.0%), and Paiute (3.3%, a difference of 6.2%).
| Demographics | Rating | Rank | Single Father Households |
| Natives/Alaskans | 0.0 /100 | #333 | Tragic 3.2% |
| Yuman | 0.0 /100 | #334 | Tragic 3.3% |
| Colville | 0.0 /100 | #335 | Tragic 3.3% |
| Paiute | 0.0 /100 | #336 | Tragic 3.3% |
| Pueblo | 0.0 /100 | #337 | Tragic 3.3% |
| Sioux | 0.0 /100 | #338 | Tragic 3.3% |
| Alaskan Athabascans | 0.0 /100 | #339 | Tragic 3.4% |
| Alaska Natives | 0.0 /100 | #340 | Tragic 3.5% |
| Crow | 0.0 /100 | #341 | Tragic 3.5% |
| Tohono O'odham | 0.0 /100 | #342 | Tragic 3.8% |
| Pima | 0.0 /100 | #343 | Tragic 4.2% |
| Yakama | 0.0 /100 | #344 | Tragic 4.2% |
| Menominee | 0.0 /100 | #345 | Tragic 4.2% |
| Inupiat | 0.0 /100 | #346 | Tragic 4.9% |
| Yup'ik | 0.0 /100 | #347 | Tragic 5.4% |
Demographics Similar to Immigrants from India by Single Father Households
In terms of single father households, the demographic groups most similar to Immigrants from India are Immigrants from Iran (1.9%, a difference of 0.23%), Immigrants from Eastern Asia (1.9%, a difference of 0.43%), Indian (Asian) (1.9%, a difference of 0.50%), Immigrants from Lithuania (1.9%, a difference of 0.58%), and Iranian (1.9%, a difference of 1.3%).
| Demographics | Rating | Rank | Single Father Households |
| Okinawans | 100.0 /100 | #10 | Exceptional 1.9% |
| Immigrants | Belarus | 100.0 /100 | #11 | Exceptional 1.9% |
| Immigrants | Greece | 100.0 /100 | #12 | Exceptional 1.9% |
| Immigrants | Singapore | 100.0 /100 | #13 | Exceptional 1.9% |
| Immigrants | Lithuania | 100.0 /100 | #14 | Exceptional 1.9% |
| Immigrants | Eastern Asia | 100.0 /100 | #15 | Exceptional 1.9% |
| Immigrants | Iran | 100.0 /100 | #16 | Exceptional 1.9% |
| Immigrants | India | 100.0 /100 | #17 | Exceptional 1.9% |
| Indians (Asian) | 100.0 /100 | #18 | Exceptional 1.9% |
| Iranians | 100.0 /100 | #19 | Exceptional 1.9% |
| Thais | 100.0 /100 | #20 | Exceptional 1.9% |
| Immigrants | Albania | 100.0 /100 | #21 | Exceptional 1.9% |
| Immigrants | Latvia | 100.0 /100 | #22 | Exceptional 1.9% |
| Immigrants | Croatia | 100.0 /100 | #23 | Exceptional 2.0% |
| Immigrants | Russia | 100.0 /100 | #24 | Exceptional 2.0% |