Immigrants from Italy vs Immigrants from Grenada Family Households
COMPARE
Immigrants from Italy
Immigrants from Grenada
Family Households
Family Households Comparison
Immigrants from Italy
Immigrants from Grenada
64.8%
FAMILY HOUSEHOLDS
90.2/ 100
METRIC RATING
130th/ 347
METRIC RANK
62.6%
FAMILY HOUSEHOLDS
0.0/ 100
METRIC RATING
290th/ 347
METRIC RANK
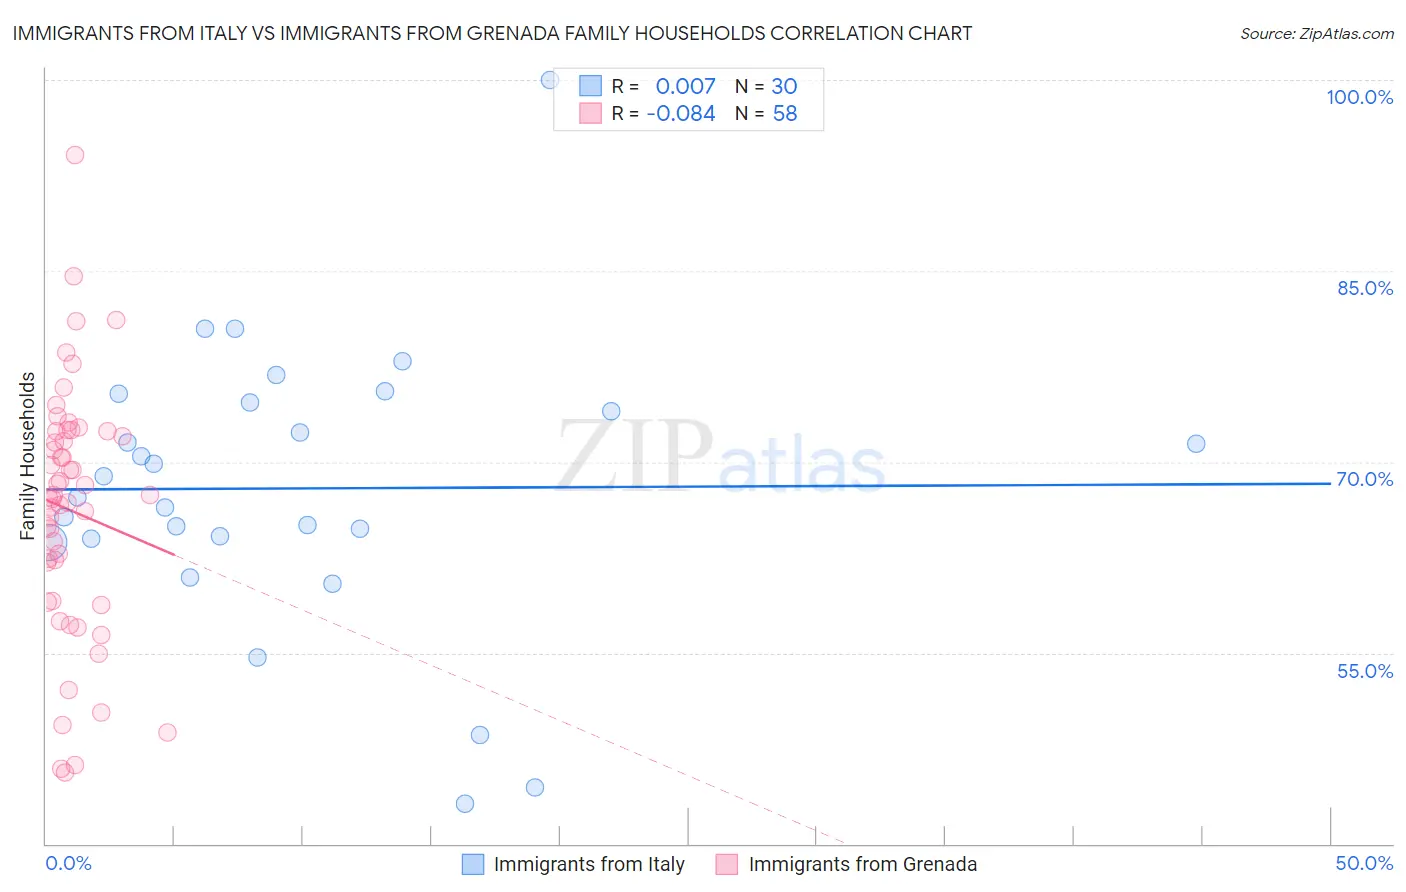
Immigrants from Italy vs Immigrants from Grenada Family Households Correlation Chart
The statistical analysis conducted on geographies consisting of 324,146,705 people shows no correlation between the proportion of Immigrants from Italy and percentage of family households in the United States with a correlation coefficient (R) of 0.007 and weighted average of 64.8%. Similarly, the statistical analysis conducted on geographies consisting of 67,190,411 people shows a slight negative correlation between the proportion of Immigrants from Grenada and percentage of family households in the United States with a correlation coefficient (R) of -0.084 and weighted average of 62.6%, a difference of 3.4%.
Family Households Correlation Summary
| Measurement | Immigrants from Italy | Immigrants from Grenada |
| Minimum | 43.1% | 45.6% |
| Maximum | 100.0% | 94.1% |
| Range | 56.9% | 48.5% |
| Mean | 67.9% | 66.2% |
| Median | 68.1% | 67.3% |
| Interquartile 25% (IQ1) | 63.9% | 59.1% |
| Interquartile 75% (IQ3) | 74.7% | 72.4% |
| Interquartile Range (IQR) | 10.7% | 13.3% |
| Standard Deviation (Sample) | 11.3% | 9.8% |
| Standard Deviation (Population) | 11.1% | 9.7% |
Similar Demographics by Family Households
Demographics Similar to Immigrants from Italy by Family Households
In terms of family households, the demographic groups most similar to Immigrants from Italy are Nonimmigrants (64.8%, a difference of 0.010%), Cajun (64.8%, a difference of 0.030%), Belizean (64.8%, a difference of 0.040%), Immigrants from Ecuador (64.8%, a difference of 0.050%), and Immigrants from Panama (64.8%, a difference of 0.070%).
| Demographics | Rating | Rank | Family Households |
| Choctaw | 93.4 /100 | #123 | Exceptional 64.9% |
| Immigrants | Argentina | 92.8 /100 | #124 | Exceptional 64.9% |
| Immigrants | Belize | 92.7 /100 | #125 | Exceptional 64.9% |
| Panamanians | 92.4 /100 | #126 | Exceptional 64.8% |
| Immigrants | Panama | 92.0 /100 | #127 | Exceptional 64.8% |
| Italians | 91.9 /100 | #128 | Exceptional 64.8% |
| Immigrants | Ecuador | 91.4 /100 | #129 | Exceptional 64.8% |
| Immigrants | Italy | 90.2 /100 | #130 | Exceptional 64.8% |
| Immigrants | Nonimmigrants | 90.1 /100 | #131 | Exceptional 64.8% |
| Cajuns | 89.4 /100 | #132 | Excellent 64.8% |
| Belizeans | 89.3 /100 | #133 | Excellent 64.8% |
| Greeks | 88.1 /100 | #134 | Excellent 64.7% |
| Maltese | 87.4 /100 | #135 | Excellent 64.7% |
| Immigrants | China | 86.6 /100 | #136 | Excellent 64.7% |
| Immigrants | Scotland | 86.4 /100 | #137 | Excellent 64.7% |
Demographics Similar to Immigrants from Grenada by Family Households
In terms of family households, the demographic groups most similar to Immigrants from Grenada are U.S. Virgin Islander (62.6%, a difference of 0.050%), Immigrants from Nepal (62.7%, a difference of 0.080%), Immigrants from Burma/Myanmar (62.6%, a difference of 0.10%), Immigrants from Uganda (62.7%, a difference of 0.17%), and British West Indian (62.8%, a difference of 0.19%).
| Demographics | Rating | Rank | Family Households |
| Immigrants | Denmark | 0.1 /100 | #283 | Tragic 62.9% |
| Australians | 0.1 /100 | #284 | Tragic 62.8% |
| Mongolians | 0.1 /100 | #285 | Tragic 62.8% |
| British West Indians | 0.1 /100 | #286 | Tragic 62.8% |
| Latvians | 0.1 /100 | #287 | Tragic 62.8% |
| Immigrants | Uganda | 0.1 /100 | #288 | Tragic 62.7% |
| Immigrants | Nepal | 0.1 /100 | #289 | Tragic 62.7% |
| Immigrants | Grenada | 0.0 /100 | #290 | Tragic 62.6% |
| U.S. Virgin Islanders | 0.0 /100 | #291 | Tragic 62.6% |
| Immigrants | Burma/Myanmar | 0.0 /100 | #292 | Tragic 62.6% |
| Immigrants | Sweden | 0.0 /100 | #293 | Tragic 62.5% |
| Barbadians | 0.0 /100 | #294 | Tragic 62.5% |
| Okinawans | 0.0 /100 | #295 | Tragic 62.5% |
| Slovenes | 0.0 /100 | #296 | Tragic 62.4% |
| French American Indians | 0.0 /100 | #297 | Tragic 62.4% |