Native/Alaskan vs Kiowa Family Households
COMPARE
Native/Alaskan
Kiowa
Family Households
Family Households Comparison
Natives/Alaskans
Kiowa
66.4%
FAMILY HOUSEHOLDS
100.0/ 100
METRIC RATING
51st/ 347
METRIC RANK
61.4%
FAMILY HOUSEHOLDS
0.0/ 100
METRIC RATING
328th/ 347
METRIC RANK
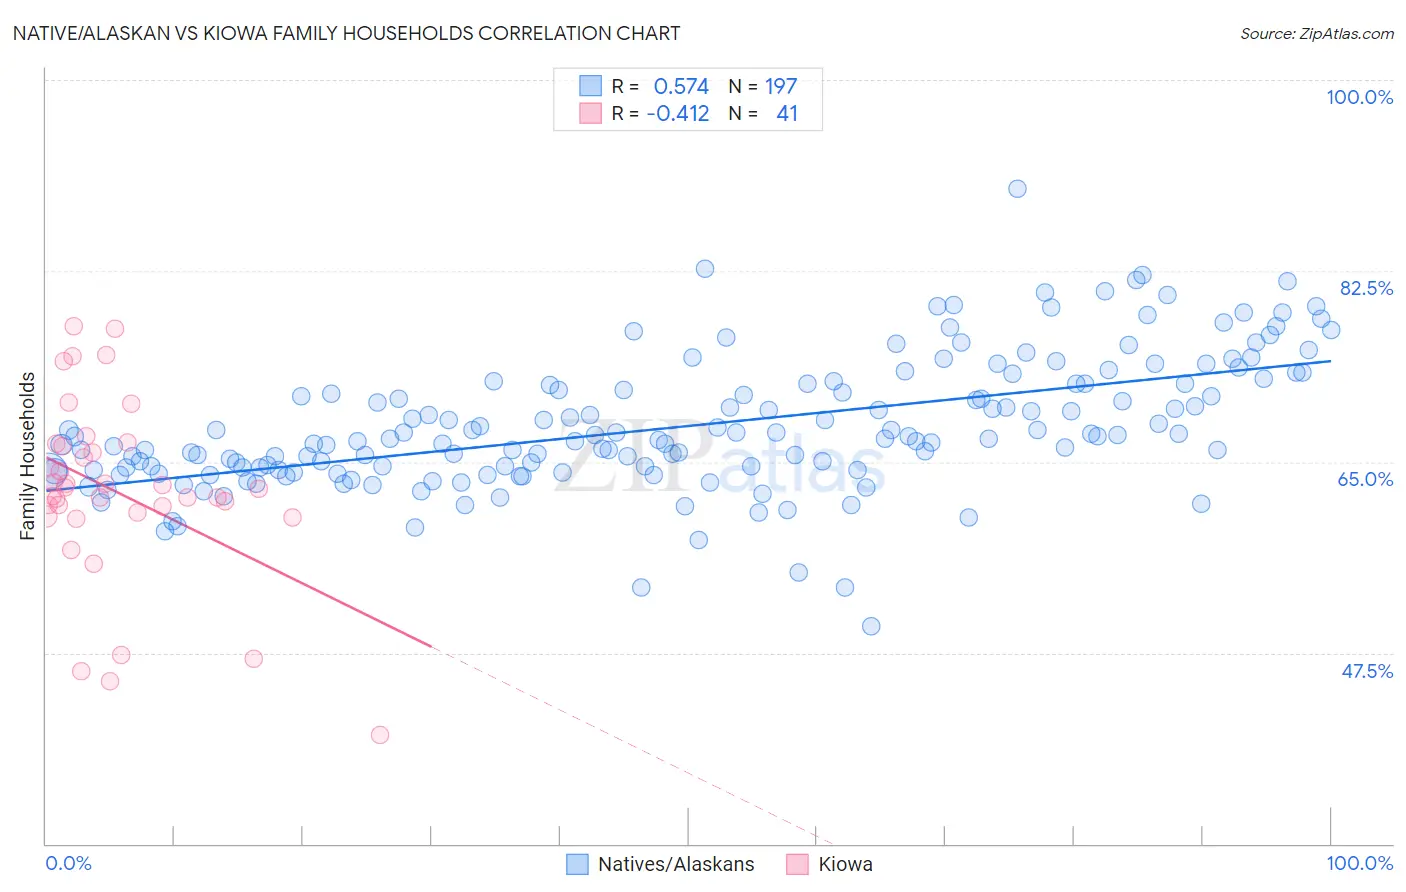
Native/Alaskan vs Kiowa Family Households Correlation Chart
The statistical analysis conducted on geographies consisting of 512,654,863 people shows a substantial positive correlation between the proportion of Natives/Alaskans and percentage of family households in the United States with a correlation coefficient (R) of 0.574 and weighted average of 66.4%. Similarly, the statistical analysis conducted on geographies consisting of 56,099,396 people shows a moderate negative correlation between the proportion of Kiowa and percentage of family households in the United States with a correlation coefficient (R) of -0.412 and weighted average of 61.4%, a difference of 8.1%.
Family Households Correlation Summary
| Measurement | Native/Alaskan | Kiowa |
| Minimum | 49.9% | 40.0% |
| Maximum | 90.0% | 77.4% |
| Range | 40.1% | 37.4% |
| Mean | 68.3% | 62.3% |
| Median | 67.2% | 62.6% |
| Interquartile 25% (IQ1) | 64.2% | 60.1% |
| Interquartile 75% (IQ3) | 72.1% | 66.6% |
| Interquartile Range (IQR) | 7.9% | 6.4% |
| Standard Deviation (Sample) | 6.0% | 8.3% |
| Standard Deviation (Population) | 6.0% | 8.2% |
Similar Demographics by Family Households
Demographics Similar to Natives/Alaskans by Family Households
In terms of family households, the demographic groups most similar to Natives/Alaskans are Navajo (66.4%, a difference of 0.030%), Immigrants from South Central Asia (66.4%, a difference of 0.090%), Immigrants from Venezuela (66.4%, a difference of 0.14%), Colombian (66.3%, a difference of 0.14%), and Afghan (66.3%, a difference of 0.14%).
| Demographics | Rating | Rank | Family Households |
| Asians | 100.0 /100 | #44 | Exceptional 66.5% |
| Venezuelans | 100.0 /100 | #45 | Exceptional 66.5% |
| Arapaho | 100.0 /100 | #46 | Exceptional 66.5% |
| Bolivians | 100.0 /100 | #47 | Exceptional 66.5% |
| Immigrants | Venezuela | 100.0 /100 | #48 | Exceptional 66.4% |
| Immigrants | South Central Asia | 100.0 /100 | #49 | Exceptional 66.4% |
| Navajo | 100.0 /100 | #50 | Exceptional 66.4% |
| Natives/Alaskans | 100.0 /100 | #51 | Exceptional 66.4% |
| Colombians | 100.0 /100 | #52 | Exceptional 66.3% |
| Afghans | 100.0 /100 | #53 | Exceptional 66.3% |
| Immigrants | Colombia | 100.0 /100 | #54 | Exceptional 66.3% |
| Immigrants | Immigrants | 100.0 /100 | #55 | Exceptional 66.1% |
| Immigrants | Hong Kong | 100.0 /100 | #56 | Exceptional 66.1% |
| Pennsylvania Germans | 100.0 /100 | #57 | Exceptional 66.1% |
| Immigrants | Asia | 100.0 /100 | #58 | Exceptional 66.1% |
Demographics Similar to Kiowa by Family Households
In terms of family households, the demographic groups most similar to Kiowa are Cambodian (61.4%, a difference of 0.030%), Black/African American (61.5%, a difference of 0.13%), Indonesian (61.5%, a difference of 0.15%), Immigrants from Australia (61.3%, a difference of 0.16%), and Immigrants from France (61.3%, a difference of 0.16%).
| Demographics | Rating | Rank | Family Households |
| Alsatians | 0.0 /100 | #321 | Tragic 61.7% |
| Immigrants | Serbia | 0.0 /100 | #322 | Tragic 61.6% |
| Tlingit-Haida | 0.0 /100 | #323 | Tragic 61.6% |
| Immigrants | West Indies | 0.0 /100 | #324 | Tragic 61.6% |
| Immigrants | Switzerland | 0.0 /100 | #325 | Tragic 61.6% |
| Indonesians | 0.0 /100 | #326 | Tragic 61.5% |
| Blacks/African Americans | 0.0 /100 | #327 | Tragic 61.5% |
| Kiowa | 0.0 /100 | #328 | Tragic 61.4% |
| Cambodians | 0.0 /100 | #329 | Tragic 61.4% |
| Immigrants | Australia | 0.0 /100 | #330 | Tragic 61.3% |
| Immigrants | France | 0.0 /100 | #331 | Tragic 61.3% |
| Ethiopians | 0.0 /100 | #332 | Tragic 61.2% |
| Immigrants | Ethiopia | 0.0 /100 | #333 | Tragic 61.2% |
| Immigrants | Eastern Africa | 0.0 /100 | #334 | Tragic 61.1% |
| Carpatho Rusyns | 0.0 /100 | #335 | Tragic 61.1% |