Aleut vs Immigrants from Grenada Family Households
COMPARE
Aleut
Immigrants from Grenada
Family Households
Family Households Comparison
Aleuts
Immigrants from Grenada
63.4%
FAMILY HOUSEHOLDS
1.9/ 100
METRIC RATING
239th/ 347
METRIC RANK
62.6%
FAMILY HOUSEHOLDS
0.0/ 100
METRIC RATING
290th/ 347
METRIC RANK
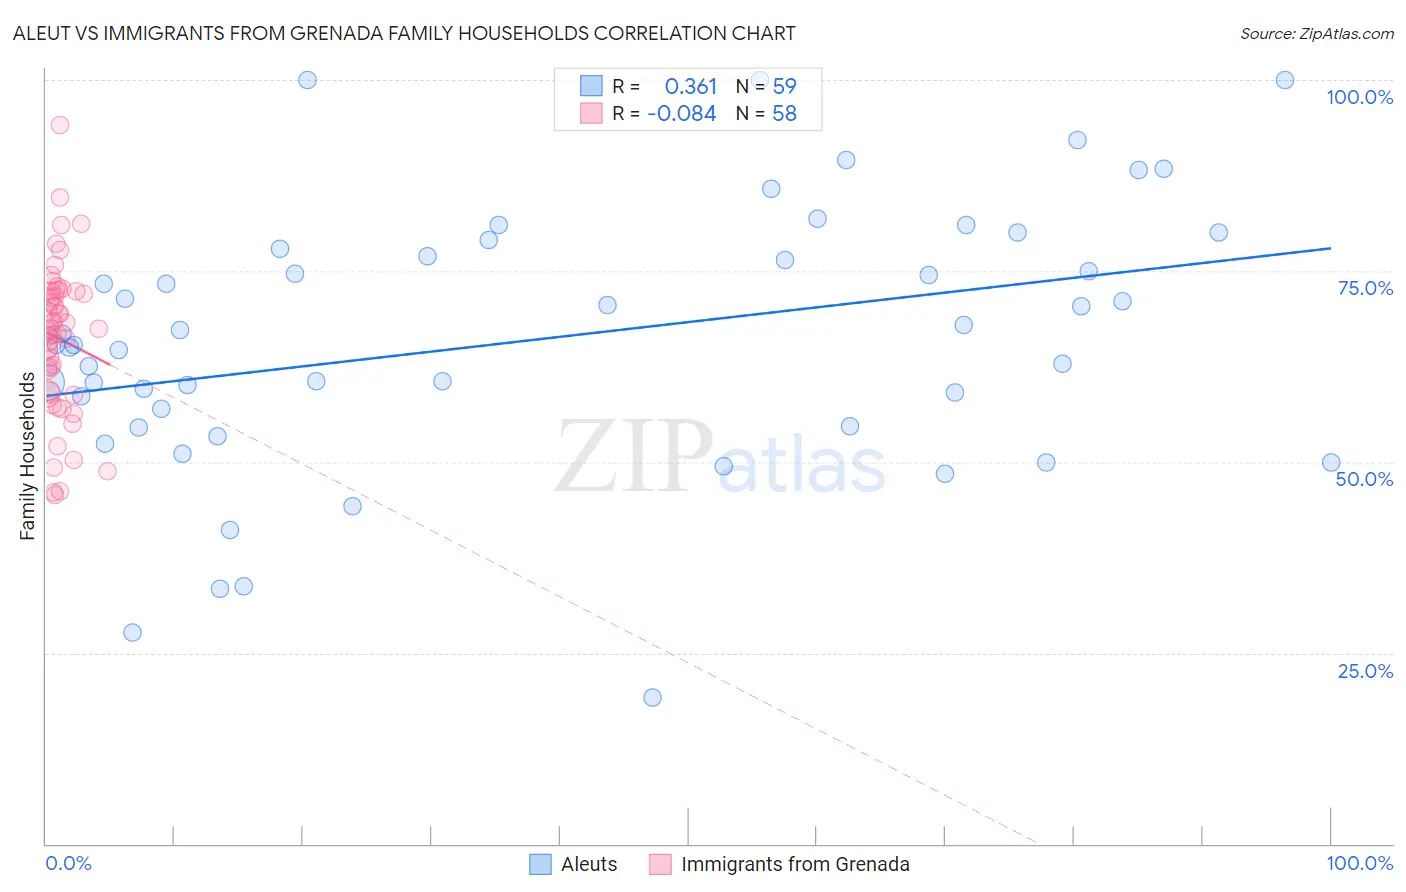
Aleut vs Immigrants from Grenada Family Households Correlation Chart
The statistical analysis conducted on geographies consisting of 61,774,066 people shows a mild positive correlation between the proportion of Aleuts and percentage of family households in the United States with a correlation coefficient (R) of 0.361 and weighted average of 63.4%. Similarly, the statistical analysis conducted on geographies consisting of 67,190,411 people shows a slight negative correlation between the proportion of Immigrants from Grenada and percentage of family households in the United States with a correlation coefficient (R) of -0.084 and weighted average of 62.6%, a difference of 1.3%.
Family Households Correlation Summary
| Measurement | Aleut | Immigrants from Grenada |
| Minimum | 19.2% | 45.6% |
| Maximum | 100.0% | 94.1% |
| Range | 80.8% | 48.5% |
| Mean | 66.1% | 66.2% |
| Median | 65.4% | 67.3% |
| Interquartile 25% (IQ1) | 54.7% | 59.1% |
| Interquartile 75% (IQ3) | 77.9% | 72.4% |
| Interquartile Range (IQR) | 23.2% | 13.3% |
| Standard Deviation (Sample) | 17.3% | 9.8% |
| Standard Deviation (Population) | 17.2% | 9.7% |
Similar Demographics by Family Households
Demographics Similar to Aleuts by Family Households
In terms of family households, the demographic groups most similar to Aleuts are South African (63.4%, a difference of 0.0%), Immigrants from St. Vincent and the Grenadines (63.4%, a difference of 0.010%), Immigrants from Israel (63.4%, a difference of 0.010%), Comanche (63.5%, a difference of 0.030%), and Immigrants from Zimbabwe (63.5%, a difference of 0.030%).
| Demographics | Rating | Rank | Family Households |
| Immigrants | Northern Africa | 2.6 /100 | #232 | Tragic 63.5% |
| Immigrants | Armenia | 2.6 /100 | #233 | Tragic 63.5% |
| Finns | 2.3 /100 | #234 | Tragic 63.5% |
| Albanians | 2.2 /100 | #235 | Tragic 63.5% |
| Ghanaians | 2.1 /100 | #236 | Tragic 63.5% |
| Comanche | 2.1 /100 | #237 | Tragic 63.5% |
| Immigrants | Zimbabwe | 2.0 /100 | #238 | Tragic 63.5% |
| Aleuts | 1.9 /100 | #239 | Tragic 63.4% |
| South Africans | 1.9 /100 | #240 | Tragic 63.4% |
| Immigrants | St. Vincent and the Grenadines | 1.9 /100 | #241 | Tragic 63.4% |
| Immigrants | Israel | 1.8 /100 | #242 | Tragic 63.4% |
| Immigrants | Czechoslovakia | 1.8 /100 | #243 | Tragic 63.4% |
| Eastern Europeans | 1.6 /100 | #244 | Tragic 63.4% |
| Immigrants | Dominica | 1.6 /100 | #245 | Tragic 63.4% |
| Immigrants | Ghana | 1.6 /100 | #246 | Tragic 63.4% |
Demographics Similar to Immigrants from Grenada by Family Households
In terms of family households, the demographic groups most similar to Immigrants from Grenada are U.S. Virgin Islander (62.6%, a difference of 0.050%), Immigrants from Nepal (62.7%, a difference of 0.080%), Immigrants from Burma/Myanmar (62.6%, a difference of 0.10%), Immigrants from Uganda (62.7%, a difference of 0.17%), and British West Indian (62.8%, a difference of 0.19%).
| Demographics | Rating | Rank | Family Households |
| Immigrants | Denmark | 0.1 /100 | #283 | Tragic 62.9% |
| Australians | 0.1 /100 | #284 | Tragic 62.8% |
| Mongolians | 0.1 /100 | #285 | Tragic 62.8% |
| British West Indians | 0.1 /100 | #286 | Tragic 62.8% |
| Latvians | 0.1 /100 | #287 | Tragic 62.8% |
| Immigrants | Uganda | 0.1 /100 | #288 | Tragic 62.7% |
| Immigrants | Nepal | 0.1 /100 | #289 | Tragic 62.7% |
| Immigrants | Grenada | 0.0 /100 | #290 | Tragic 62.6% |
| U.S. Virgin Islanders | 0.0 /100 | #291 | Tragic 62.6% |
| Immigrants | Burma/Myanmar | 0.0 /100 | #292 | Tragic 62.6% |
| Immigrants | Sweden | 0.0 /100 | #293 | Tragic 62.5% |
| Barbadians | 0.0 /100 | #294 | Tragic 62.5% |
| Okinawans | 0.0 /100 | #295 | Tragic 62.5% |
| Slovenes | 0.0 /100 | #296 | Tragic 62.4% |
| French American Indians | 0.0 /100 | #297 | Tragic 62.4% |