Subsaharan African vs Immigrants from Grenada Family Households
COMPARE
Subsaharan African
Immigrants from Grenada
Family Households
Family Households Comparison
Sub-Saharan Africans
Immigrants from Grenada
62.1%
FAMILY HOUSEHOLDS
0.0/ 100
METRIC RATING
309th/ 347
METRIC RANK
62.6%
FAMILY HOUSEHOLDS
0.0/ 100
METRIC RATING
290th/ 347
METRIC RANK
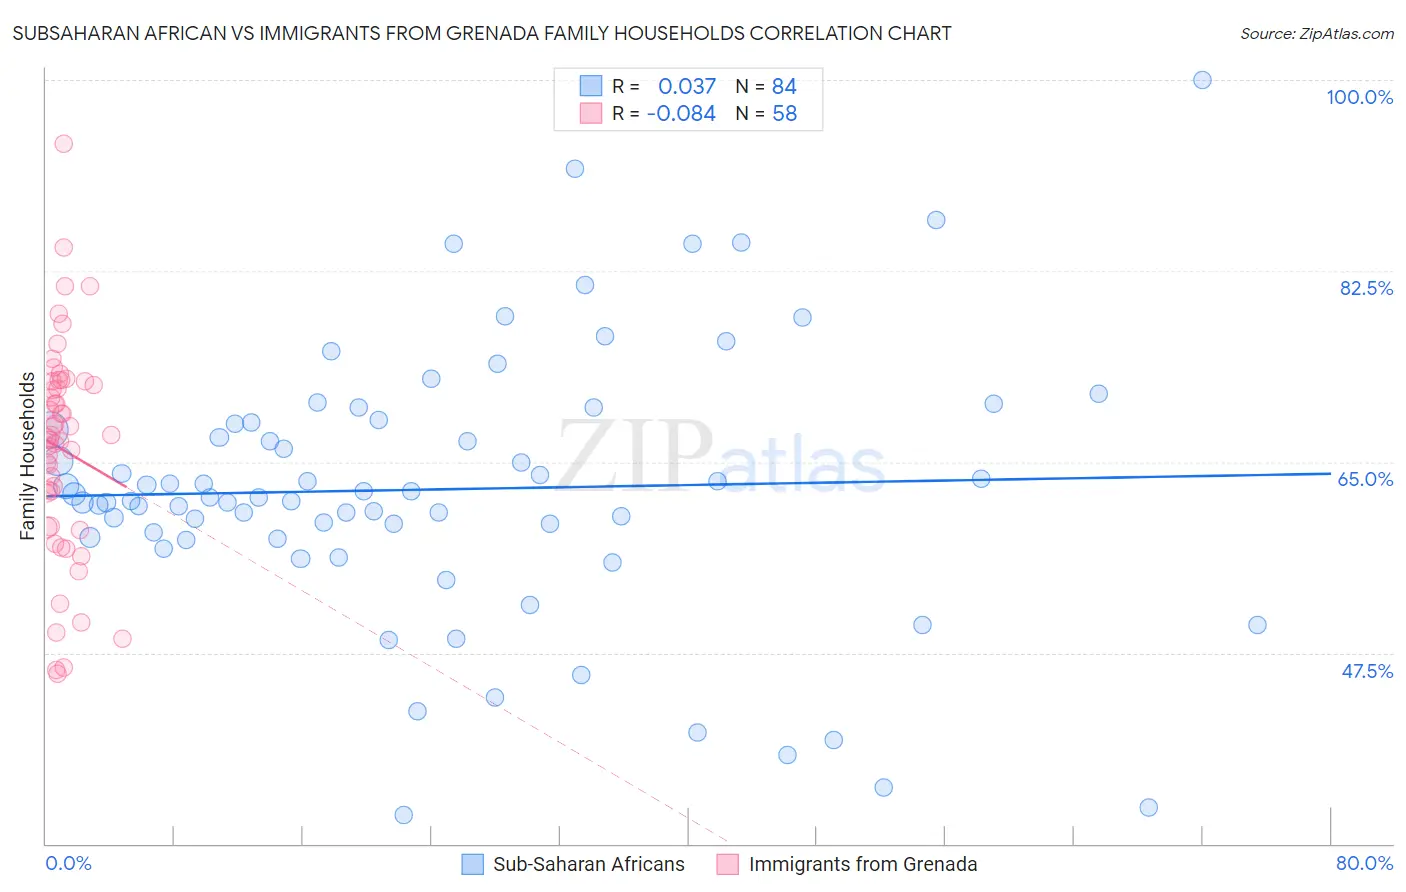
Subsaharan African vs Immigrants from Grenada Family Households Correlation Chart
The statistical analysis conducted on geographies consisting of 507,604,715 people shows no correlation between the proportion of Sub-Saharan Africans and percentage of family households in the United States with a correlation coefficient (R) of 0.037 and weighted average of 62.1%. Similarly, the statistical analysis conducted on geographies consisting of 67,190,411 people shows a slight negative correlation between the proportion of Immigrants from Grenada and percentage of family households in the United States with a correlation coefficient (R) of -0.084 and weighted average of 62.6%, a difference of 0.96%.
Family Households Correlation Summary
| Measurement | Subsaharan African | Immigrants from Grenada |
| Minimum | 32.6% | 45.6% |
| Maximum | 100.0% | 94.1% |
| Range | 67.4% | 48.5% |
| Mean | 62.5% | 66.2% |
| Median | 61.7% | 67.3% |
| Interquartile 25% (IQ1) | 58.0% | 59.1% |
| Interquartile 75% (IQ3) | 68.6% | 72.4% |
| Interquartile Range (IQR) | 10.5% | 13.3% |
| Standard Deviation (Sample) | 12.5% | 9.8% |
| Standard Deviation (Population) | 12.4% | 9.7% |
Demographics Similar to Sub-Saharan Africans and Immigrants from Grenada by Family Households
In terms of family households, the demographic groups most similar to Sub-Saharan Africans are Immigrants from Norway (62.1%, a difference of 0.050%), Chippewa (62.1%, a difference of 0.050%), African (62.1%, a difference of 0.14%), Bermudan (62.2%, a difference of 0.16%), and Iroquois (62.2%, a difference of 0.31%). Similarly, the demographic groups most similar to Immigrants from Grenada are U.S. Virgin Islander (62.6%, a difference of 0.050%), Immigrants from Nepal (62.7%, a difference of 0.080%), Immigrants from Burma/Myanmar (62.6%, a difference of 0.10%), Immigrants from Sweden (62.5%, a difference of 0.23%), and Barbadian (62.5%, a difference of 0.29%).
| Demographics | Rating | Rank | Family Households |
| Immigrants | Nepal | 0.1 /100 | #289 | Tragic 62.7% |
| Immigrants | Grenada | 0.0 /100 | #290 | Tragic 62.6% |
| U.S. Virgin Islanders | 0.0 /100 | #291 | Tragic 62.6% |
| Immigrants | Burma/Myanmar | 0.0 /100 | #292 | Tragic 62.6% |
| Immigrants | Sweden | 0.0 /100 | #293 | Tragic 62.5% |
| Barbadians | 0.0 /100 | #294 | Tragic 62.5% |
| Okinawans | 0.0 /100 | #295 | Tragic 62.5% |
| Slovenes | 0.0 /100 | #296 | Tragic 62.4% |
| French American Indians | 0.0 /100 | #297 | Tragic 62.4% |
| Immigrants | Spain | 0.0 /100 | #298 | Tragic 62.4% |
| Immigrants | Kuwait | 0.0 /100 | #299 | Tragic 62.4% |
| Immigrants | Africa | 0.0 /100 | #300 | Tragic 62.4% |
| Immigrants | Albania | 0.0 /100 | #301 | Tragic 62.4% |
| Immigrants | Kenya | 0.0 /100 | #302 | Tragic 62.3% |
| Cree | 0.0 /100 | #303 | Tragic 62.3% |
| Iroquois | 0.0 /100 | #304 | Tragic 62.2% |
| Bermudans | 0.0 /100 | #305 | Tragic 62.2% |
| Africans | 0.0 /100 | #306 | Tragic 62.1% |
| Immigrants | Norway | 0.0 /100 | #307 | Tragic 62.1% |
| Chippewa | 0.0 /100 | #308 | Tragic 62.1% |
| Sub-Saharan Africans | 0.0 /100 | #309 | Tragic 62.1% |