Immigrants from Barbados vs Croatian Family Households
COMPARE
Immigrants from Barbados
Croatian
Family Households
Family Households Comparison
Immigrants from Barbados
Croatians
63.2%
FAMILY HOUSEHOLDS
0.7/ 100
METRIC RATING
258th/ 347
METRIC RANK
63.8%
FAMILY HOUSEHOLDS
7.3/ 100
METRIC RATING
216th/ 347
METRIC RANK
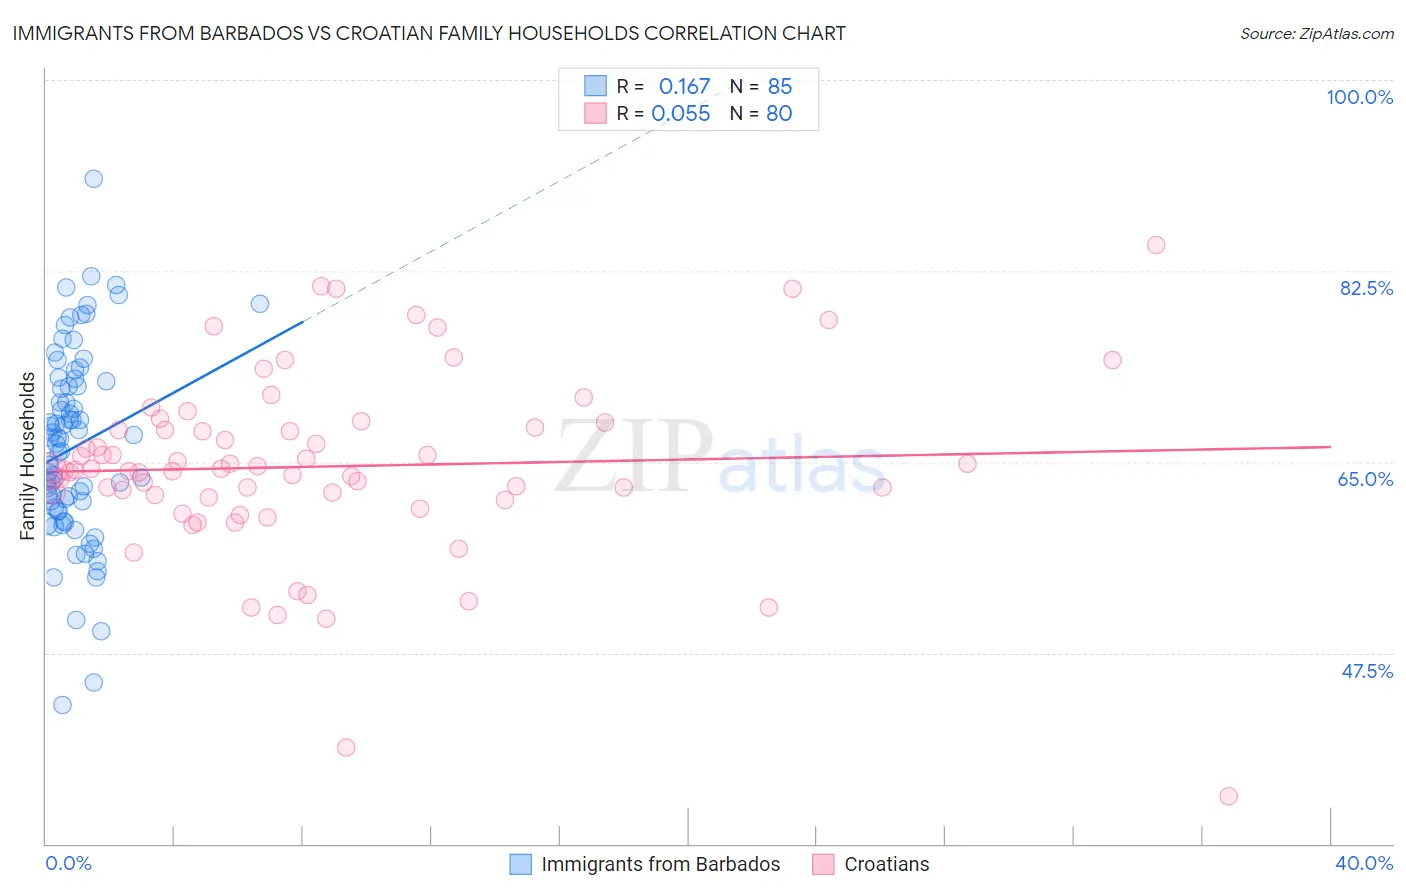
Immigrants from Barbados vs Croatian Family Households Correlation Chart
The statistical analysis conducted on geographies consisting of 112,769,646 people shows a poor positive correlation between the proportion of Immigrants from Barbados and percentage of family households in the United States with a correlation coefficient (R) of 0.167 and weighted average of 63.2%. Similarly, the statistical analysis conducted on geographies consisting of 375,542,706 people shows a slight positive correlation between the proportion of Croatians and percentage of family households in the United States with a correlation coefficient (R) of 0.055 and weighted average of 63.8%, a difference of 0.84%.
Family Households Correlation Summary
| Measurement | Immigrants from Barbados | Croatian |
| Minimum | 42.7% | 34.4% |
| Maximum | 91.0% | 84.8% |
| Range | 48.2% | 50.4% |
| Mean | 66.3% | 64.6% |
| Median | 66.6% | 64.2% |
| Interquartile 25% (IQ1) | 60.7% | 61.9% |
| Interquartile 75% (IQ3) | 72.2% | 68.1% |
| Interquartile Range (IQR) | 11.5% | 6.2% |
| Standard Deviation (Sample) | 8.7% | 8.4% |
| Standard Deviation (Population) | 8.6% | 8.4% |
Similar Demographics by Family Households
Demographics Similar to Immigrants from Barbados by Family Households
In terms of family households, the demographic groups most similar to Immigrants from Barbados are Immigrants from Western Europe (63.2%, a difference of 0.010%), Cypriot (63.2%, a difference of 0.030%), Immigrants from Russia (63.2%, a difference of 0.050%), Immigrants from Ireland (63.2%, a difference of 0.060%), and Icelander (63.3%, a difference of 0.070%).
| Demographics | Rating | Rank | Family Households |
| Taiwanese | 1.2 /100 | #251 | Tragic 63.3% |
| Bahamians | 1.1 /100 | #252 | Tragic 63.3% |
| Immigrants | Dominican Republic | 1.0 /100 | #253 | Tragic 63.3% |
| Slovaks | 1.0 /100 | #254 | Tragic 63.3% |
| Potawatomi | 1.0 /100 | #255 | Tragic 63.3% |
| Luxembourgers | 0.9 /100 | #256 | Tragic 63.3% |
| Icelanders | 0.8 /100 | #257 | Tragic 63.3% |
| Immigrants | Barbados | 0.7 /100 | #258 | Tragic 63.2% |
| Immigrants | Western Europe | 0.6 /100 | #259 | Tragic 63.2% |
| Cypriots | 0.6 /100 | #260 | Tragic 63.2% |
| Immigrants | Russia | 0.6 /100 | #261 | Tragic 63.2% |
| Immigrants | Ireland | 0.6 /100 | #262 | Tragic 63.2% |
| Cheyenne | 0.5 /100 | #263 | Tragic 63.2% |
| Kenyans | 0.5 /100 | #264 | Tragic 63.2% |
| Colville | 0.5 /100 | #265 | Tragic 63.2% |
Demographics Similar to Croatians by Family Households
In terms of family households, the demographic groups most similar to Croatians are Osage (63.7%, a difference of 0.010%), Belgian (63.8%, a difference of 0.020%), Marshallese (63.7%, a difference of 0.020%), Celtic (63.8%, a difference of 0.030%), and Macedonian (63.7%, a difference of 0.040%).
| Demographics | Rating | Rank | Family Households |
| Sierra Leoneans | 11.2 /100 | #209 | Poor 63.9% |
| Immigrants | Thailand | 9.6 /100 | #210 | Tragic 63.8% |
| Shoshone | 9.4 /100 | #211 | Tragic 63.8% |
| Immigrants | Netherlands | 9.4 /100 | #212 | Tragic 63.8% |
| Immigrants | Northern Europe | 8.8 /100 | #213 | Tragic 63.8% |
| Celtics | 8.0 /100 | #214 | Tragic 63.8% |
| Belgians | 7.6 /100 | #215 | Tragic 63.8% |
| Croatians | 7.3 /100 | #216 | Tragic 63.8% |
| Osage | 7.0 /100 | #217 | Tragic 63.7% |
| Marshallese | 6.9 /100 | #218 | Tragic 63.7% |
| Macedonians | 6.5 /100 | #219 | Tragic 63.7% |
| Immigrants | Europe | 6.4 /100 | #220 | Tragic 63.7% |
| Immigrants | South Africa | 5.9 /100 | #221 | Tragic 63.7% |
| Immigrants | Belarus | 5.5 /100 | #222 | Tragic 63.7% |
| French Canadians | 5.4 /100 | #223 | Tragic 63.7% |