Immigrants from Haiti vs Croatian Family Households
COMPARE
Immigrants from Haiti
Croatian
Family Households
Family Households Comparison
Immigrants from Haiti
Croatians
65.3%
FAMILY HOUSEHOLDS
99.1/ 100
METRIC RATING
88th/ 347
METRIC RANK
63.8%
FAMILY HOUSEHOLDS
7.3/ 100
METRIC RATING
216th/ 347
METRIC RANK
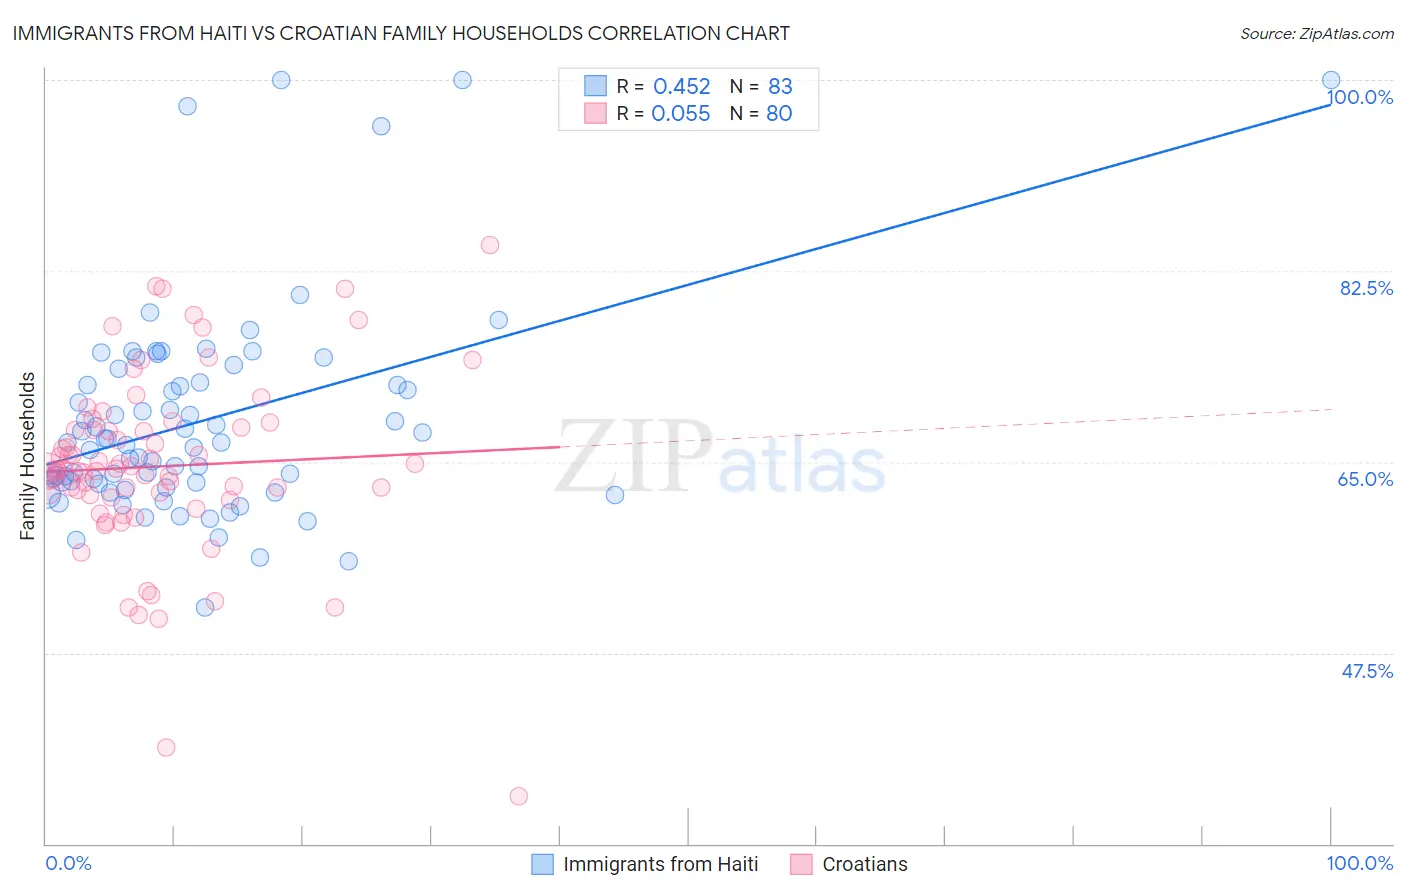
Immigrants from Haiti vs Croatian Family Households Correlation Chart
The statistical analysis conducted on geographies consisting of 225,175,344 people shows a moderate positive correlation between the proportion of Immigrants from Haiti and percentage of family households in the United States with a correlation coefficient (R) of 0.452 and weighted average of 65.3%. Similarly, the statistical analysis conducted on geographies consisting of 375,542,706 people shows a slight positive correlation between the proportion of Croatians and percentage of family households in the United States with a correlation coefficient (R) of 0.055 and weighted average of 63.8%, a difference of 2.5%.
Family Households Correlation Summary
| Measurement | Immigrants from Haiti | Croatian |
| Minimum | 51.7% | 34.4% |
| Maximum | 100.0% | 84.8% |
| Range | 48.3% | 50.4% |
| Mean | 68.7% | 64.6% |
| Median | 66.8% | 64.2% |
| Interquartile 25% (IQ1) | 63.0% | 61.9% |
| Interquartile 75% (IQ3) | 72.3% | 68.1% |
| Interquartile Range (IQR) | 9.3% | 6.2% |
| Standard Deviation (Sample) | 9.6% | 8.4% |
| Standard Deviation (Population) | 9.5% | 8.4% |
Similar Demographics by Family Households
Demographics Similar to Immigrants from Haiti by Family Households
In terms of family households, the demographic groups most similar to Immigrants from Haiti are Immigrants from Caribbean (65.3%, a difference of 0.010%), Immigrants from Laos (65.3%, a difference of 0.020%), Immigrants from Egypt (65.3%, a difference of 0.030%), Crow (65.3%, a difference of 0.070%), and Hopi (65.3%, a difference of 0.11%).
| Demographics | Rating | Rank | Family Households |
| Jordanians | 99.7 /100 | #81 | Exceptional 65.5% |
| Immigrants | Lebanon | 99.7 /100 | #82 | Exceptional 65.5% |
| Immigrants | Guyana | 99.6 /100 | #83 | Exceptional 65.5% |
| Americans | 99.6 /100 | #84 | Exceptional 65.5% |
| Immigrants | Cambodia | 99.5 /100 | #85 | Exceptional 65.4% |
| Egyptians | 99.4 /100 | #86 | Exceptional 65.4% |
| Immigrants | Egypt | 99.2 /100 | #87 | Exceptional 65.3% |
| Immigrants | Haiti | 99.1 /100 | #88 | Exceptional 65.3% |
| Immigrants | Caribbean | 99.1 /100 | #89 | Exceptional 65.3% |
| Immigrants | Laos | 99.1 /100 | #90 | Exceptional 65.3% |
| Crow | 98.9 /100 | #91 | Exceptional 65.3% |
| Hopi | 98.8 /100 | #92 | Exceptional 65.3% |
| Guyanese | 98.8 /100 | #93 | Exceptional 65.3% |
| Immigrants | Poland | 98.7 /100 | #94 | Exceptional 65.2% |
| Immigrants | Portugal | 98.6 /100 | #95 | Exceptional 65.2% |
Demographics Similar to Croatians by Family Households
In terms of family households, the demographic groups most similar to Croatians are Osage (63.7%, a difference of 0.010%), Belgian (63.8%, a difference of 0.020%), Marshallese (63.7%, a difference of 0.020%), Celtic (63.8%, a difference of 0.030%), and Macedonian (63.7%, a difference of 0.040%).
| Demographics | Rating | Rank | Family Households |
| Sierra Leoneans | 11.2 /100 | #209 | Poor 63.9% |
| Immigrants | Thailand | 9.6 /100 | #210 | Tragic 63.8% |
| Shoshone | 9.4 /100 | #211 | Tragic 63.8% |
| Immigrants | Netherlands | 9.4 /100 | #212 | Tragic 63.8% |
| Immigrants | Northern Europe | 8.8 /100 | #213 | Tragic 63.8% |
| Celtics | 8.0 /100 | #214 | Tragic 63.8% |
| Belgians | 7.6 /100 | #215 | Tragic 63.8% |
| Croatians | 7.3 /100 | #216 | Tragic 63.8% |
| Osage | 7.0 /100 | #217 | Tragic 63.7% |
| Marshallese | 6.9 /100 | #218 | Tragic 63.7% |
| Macedonians | 6.5 /100 | #219 | Tragic 63.7% |
| Immigrants | Europe | 6.4 /100 | #220 | Tragic 63.7% |
| Immigrants | South Africa | 5.9 /100 | #221 | Tragic 63.7% |
| Immigrants | Belarus | 5.5 /100 | #222 | Tragic 63.7% |
| French Canadians | 5.4 /100 | #223 | Tragic 63.7% |