Cypriot vs Croatian Family Households
COMPARE
Cypriot
Croatian
Family Households
Family Households Comparison
Cypriots
Croatians
63.2%
FAMILY HOUSEHOLDS
0.6/ 100
METRIC RATING
260th/ 347
METRIC RANK
63.8%
FAMILY HOUSEHOLDS
7.3/ 100
METRIC RATING
216th/ 347
METRIC RANK
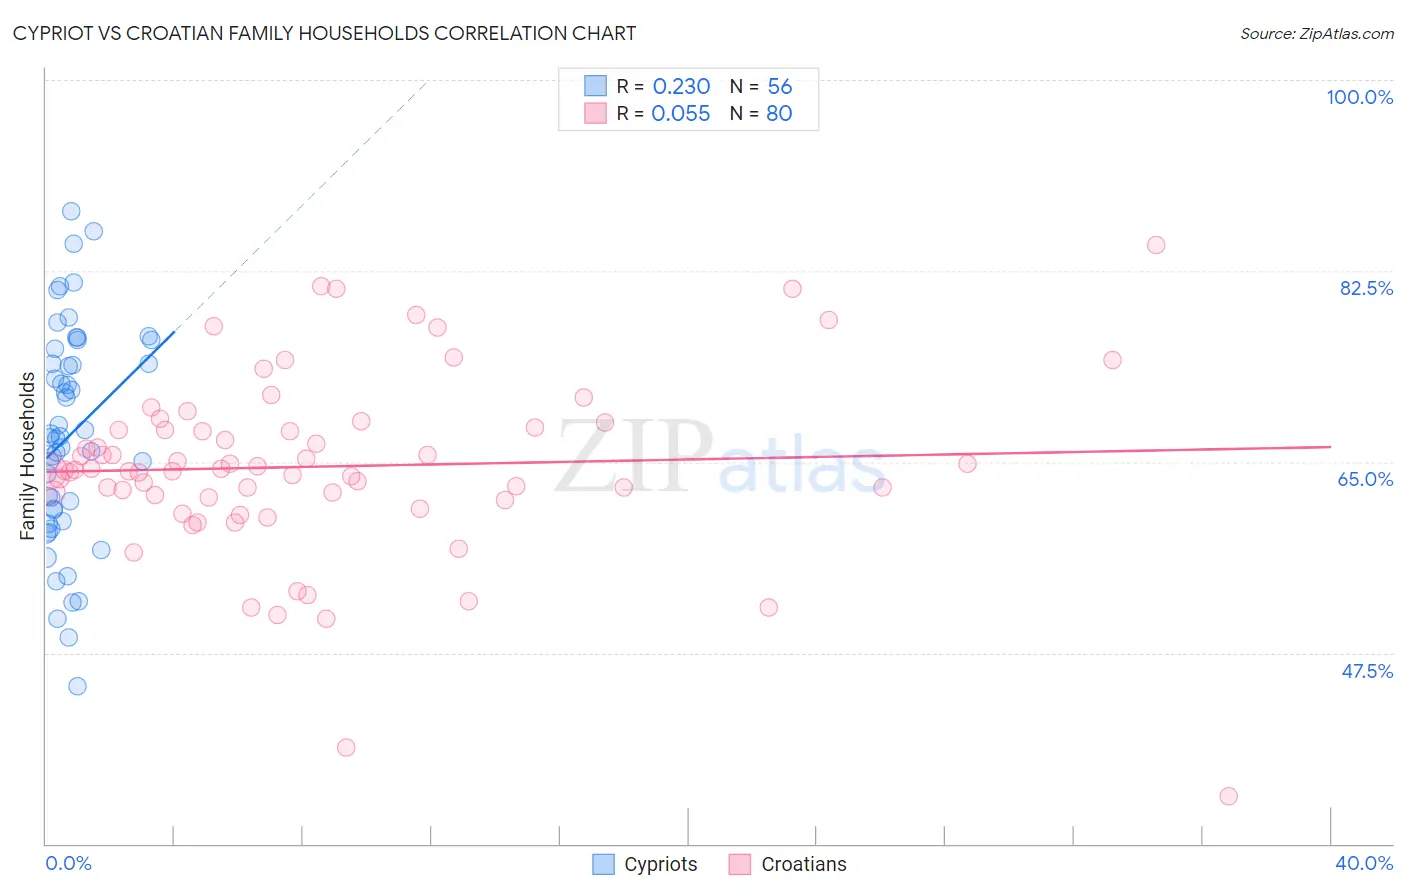
Cypriot vs Croatian Family Households Correlation Chart
The statistical analysis conducted on geographies consisting of 61,857,015 people shows a weak positive correlation between the proportion of Cypriots and percentage of family households in the United States with a correlation coefficient (R) of 0.230 and weighted average of 63.2%. Similarly, the statistical analysis conducted on geographies consisting of 375,542,706 people shows a slight positive correlation between the proportion of Croatians and percentage of family households in the United States with a correlation coefficient (R) of 0.055 and weighted average of 63.8%, a difference of 0.88%.
Family Households Correlation Summary
| Measurement | Cypriot | Croatian |
| Minimum | 44.4% | 34.4% |
| Maximum | 87.9% | 84.8% |
| Range | 43.5% | 50.4% |
| Mean | 67.4% | 64.6% |
| Median | 67.3% | 64.2% |
| Interquartile 25% (IQ1) | 60.0% | 61.9% |
| Interquartile 75% (IQ3) | 74.7% | 68.1% |
| Interquartile Range (IQR) | 14.7% | 6.2% |
| Standard Deviation (Sample) | 9.9% | 8.4% |
| Standard Deviation (Population) | 9.8% | 8.4% |
Similar Demographics by Family Households
Demographics Similar to Cypriots by Family Households
In terms of family households, the demographic groups most similar to Cypriots are Immigrants from Western Europe (63.2%, a difference of 0.020%), Immigrants from Russia (63.2%, a difference of 0.020%), Immigrants from Barbados (63.2%, a difference of 0.030%), Immigrants from Ireland (63.2%, a difference of 0.030%), and Cheyenne (63.2%, a difference of 0.050%).
| Demographics | Rating | Rank | Family Households |
| Immigrants | Dominican Republic | 1.0 /100 | #253 | Tragic 63.3% |
| Slovaks | 1.0 /100 | #254 | Tragic 63.3% |
| Potawatomi | 1.0 /100 | #255 | Tragic 63.3% |
| Luxembourgers | 0.9 /100 | #256 | Tragic 63.3% |
| Icelanders | 0.8 /100 | #257 | Tragic 63.3% |
| Immigrants | Barbados | 0.7 /100 | #258 | Tragic 63.2% |
| Immigrants | Western Europe | 0.6 /100 | #259 | Tragic 63.2% |
| Cypriots | 0.6 /100 | #260 | Tragic 63.2% |
| Immigrants | Russia | 0.6 /100 | #261 | Tragic 63.2% |
| Immigrants | Ireland | 0.6 /100 | #262 | Tragic 63.2% |
| Cheyenne | 0.5 /100 | #263 | Tragic 63.2% |
| Kenyans | 0.5 /100 | #264 | Tragic 63.2% |
| Colville | 0.5 /100 | #265 | Tragic 63.2% |
| Immigrants | Western Africa | 0.5 /100 | #266 | Tragic 63.1% |
| Israelis | 0.4 /100 | #267 | Tragic 63.1% |
Demographics Similar to Croatians by Family Households
In terms of family households, the demographic groups most similar to Croatians are Osage (63.7%, a difference of 0.010%), Belgian (63.8%, a difference of 0.020%), Marshallese (63.7%, a difference of 0.020%), Celtic (63.8%, a difference of 0.030%), and Macedonian (63.7%, a difference of 0.040%).
| Demographics | Rating | Rank | Family Households |
| Sierra Leoneans | 11.2 /100 | #209 | Poor 63.9% |
| Immigrants | Thailand | 9.6 /100 | #210 | Tragic 63.8% |
| Shoshone | 9.4 /100 | #211 | Tragic 63.8% |
| Immigrants | Netherlands | 9.4 /100 | #212 | Tragic 63.8% |
| Immigrants | Northern Europe | 8.8 /100 | #213 | Tragic 63.8% |
| Celtics | 8.0 /100 | #214 | Tragic 63.8% |
| Belgians | 7.6 /100 | #215 | Tragic 63.8% |
| Croatians | 7.3 /100 | #216 | Tragic 63.8% |
| Osage | 7.0 /100 | #217 | Tragic 63.7% |
| Marshallese | 6.9 /100 | #218 | Tragic 63.7% |
| Macedonians | 6.5 /100 | #219 | Tragic 63.7% |
| Immigrants | Europe | 6.4 /100 | #220 | Tragic 63.7% |
| Immigrants | South Africa | 5.9 /100 | #221 | Tragic 63.7% |
| Immigrants | Belarus | 5.5 /100 | #222 | Tragic 63.7% |
| French Canadians | 5.4 /100 | #223 | Tragic 63.7% |