Native Hawaiian vs Immigrants from Denmark Associate's Degree
COMPARE
Native Hawaiian
Immigrants from Denmark
Associate's Degree
Associate's Degree Comparison
Native Hawaiians
Immigrants from Denmark
43.1%
ASSOCIATE'S DEGREE
2.3/ 100
METRIC RATING
232nd/ 347
METRIC RANK
53.1%
ASSOCIATE'S DEGREE
100.0/ 100
METRIC RATING
37th/ 347
METRIC RANK
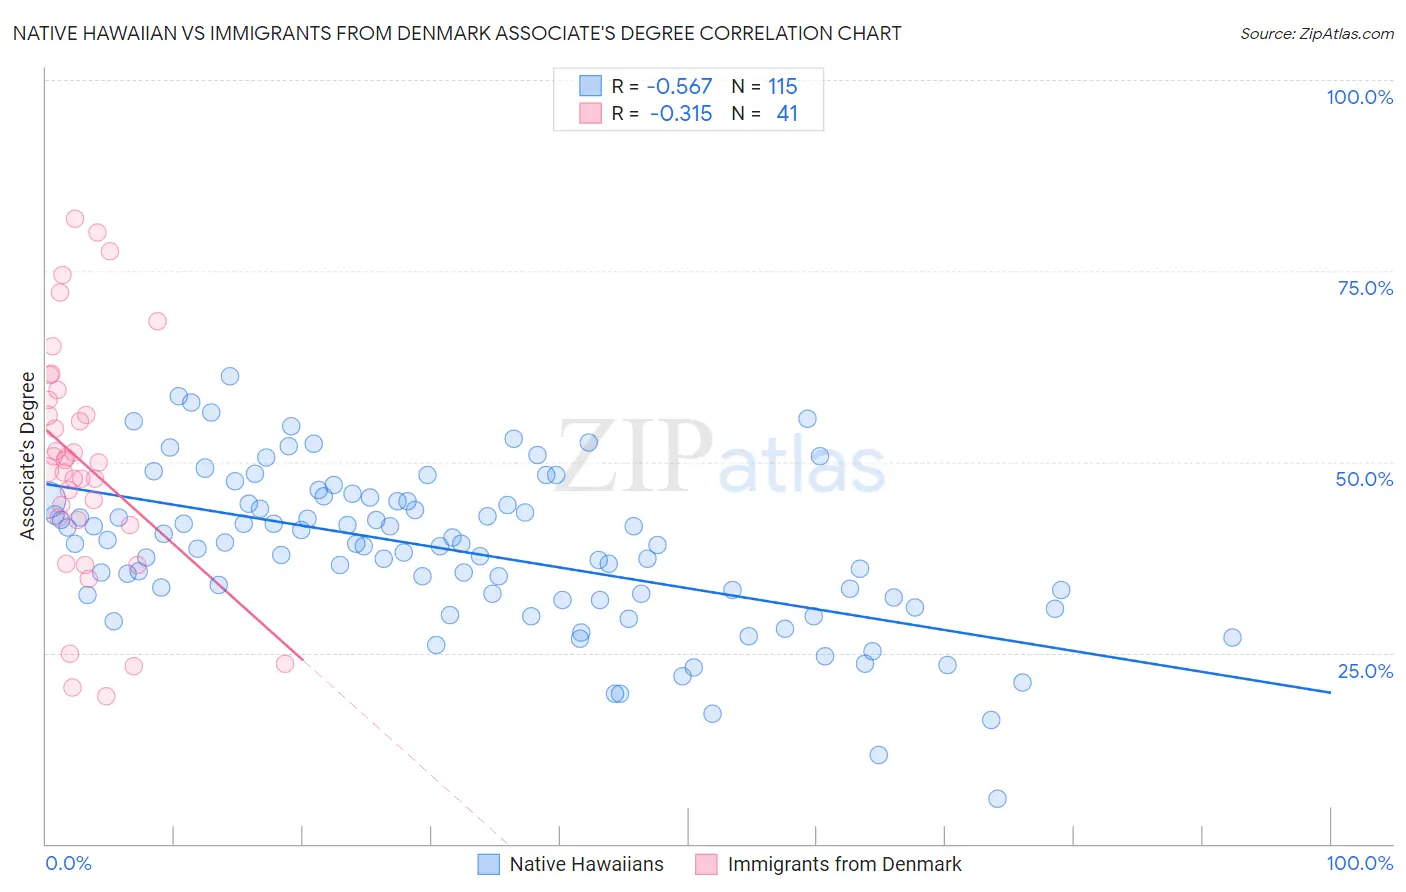
Native Hawaiian vs Immigrants from Denmark Associate's Degree Correlation Chart
The statistical analysis conducted on geographies consisting of 332,098,475 people shows a substantial negative correlation between the proportion of Native Hawaiians and percentage of population with at least associate's degree education in the United States with a correlation coefficient (R) of -0.567 and weighted average of 43.1%. Similarly, the statistical analysis conducted on geographies consisting of 136,428,731 people shows a mild negative correlation between the proportion of Immigrants from Denmark and percentage of population with at least associate's degree education in the United States with a correlation coefficient (R) of -0.315 and weighted average of 53.1%, a difference of 23.0%.
Associate's Degree Correlation Summary
| Measurement | Native Hawaiian | Immigrants from Denmark |
| Minimum | 5.9% | 19.3% |
| Maximum | 61.2% | 81.9% |
| Range | 55.3% | 62.5% |
| Mean | 38.4% | 49.9% |
| Median | 39.3% | 50.0% |
| Interquartile 25% (IQ1) | 32.3% | 42.1% |
| Interquartile 75% (IQ3) | 44.9% | 58.7% |
| Interquartile Range (IQR) | 12.6% | 16.6% |
| Standard Deviation (Sample) | 10.3% | 15.6% |
| Standard Deviation (Population) | 10.3% | 15.4% |
Similar Demographics by Associate's Degree
Demographics Similar to Native Hawaiians by Associate's Degree
In terms of associate's degree, the demographic groups most similar to Native Hawaiians are Tongan (43.0%, a difference of 0.16%), Tlingit-Haida (43.0%, a difference of 0.25%), Ecuadorian (43.0%, a difference of 0.35%), Immigrants from Barbados (43.3%, a difference of 0.43%), and Liberian (43.3%, a difference of 0.43%).
| Demographics | Rating | Rank | Associate's Degree |
| Guamanians/Chamorros | 4.8 /100 | #225 | Tragic 43.8% |
| Immigrants | Burma/Myanmar | 4.3 /100 | #226 | Tragic 43.7% |
| Trinidadians and Tobagonians | 4.0 /100 | #227 | Tragic 43.6% |
| Hmong | 3.2 /100 | #228 | Tragic 43.4% |
| Immigrants | Trinidad and Tobago | 3.0 /100 | #229 | Tragic 43.3% |
| Immigrants | Barbados | 2.9 /100 | #230 | Tragic 43.3% |
| Liberians | 2.9 /100 | #231 | Tragic 43.3% |
| Native Hawaiians | 2.3 /100 | #232 | Tragic 43.1% |
| Tongans | 2.2 /100 | #233 | Tragic 43.0% |
| Tlingit-Haida | 2.1 /100 | #234 | Tragic 43.0% |
| Ecuadorians | 2.0 /100 | #235 | Tragic 43.0% |
| Immigrants | St. Vincent and the Grenadines | 1.9 /100 | #236 | Tragic 42.9% |
| Immigrants | Nonimmigrants | 1.9 /100 | #237 | Tragic 42.9% |
| Iroquois | 1.7 /100 | #238 | Tragic 42.8% |
| Immigrants | Grenada | 1.3 /100 | #239 | Tragic 42.6% |
Demographics Similar to Immigrants from Denmark by Associate's Degree
In terms of associate's degree, the demographic groups most similar to Immigrants from Denmark are Immigrants from Russia (53.1%, a difference of 0.080%), Mongolian (53.0%, a difference of 0.16%), Russian (53.2%, a difference of 0.36%), Bulgarian (53.3%, a difference of 0.43%), and Immigrants from Belarus (52.8%, a difference of 0.45%).
| Demographics | Rating | Rank | Associate's Degree |
| Immigrants | Sri Lanka | 100.0 /100 | #30 | Exceptional 53.7% |
| Immigrants | Northern Europe | 100.0 /100 | #31 | Exceptional 53.5% |
| Immigrants | Turkey | 100.0 /100 | #32 | Exceptional 53.4% |
| Israelis | 100.0 /100 | #33 | Exceptional 53.4% |
| Bulgarians | 100.0 /100 | #34 | Exceptional 53.3% |
| Russians | 100.0 /100 | #35 | Exceptional 53.2% |
| Immigrants | Russia | 100.0 /100 | #36 | Exceptional 53.1% |
| Immigrants | Denmark | 100.0 /100 | #37 | Exceptional 53.1% |
| Mongolians | 100.0 /100 | #38 | Exceptional 53.0% |
| Immigrants | Belarus | 99.9 /100 | #39 | Exceptional 52.8% |
| Immigrants | Latvia | 99.9 /100 | #40 | Exceptional 52.8% |
| Immigrants | Saudi Arabia | 99.9 /100 | #41 | Exceptional 52.6% |
| Immigrants | Malaysia | 99.9 /100 | #42 | Exceptional 52.5% |
| Immigrants | South Africa | 99.9 /100 | #43 | Exceptional 52.5% |
| Estonians | 99.9 /100 | #44 | Exceptional 52.5% |