Native Hawaiian vs Immigrants from Armenia 3rd Grade
COMPARE
Native Hawaiian
Immigrants from Armenia
3rd Grade
3rd Grade Comparison
Native Hawaiians
Immigrants from Armenia
98.3%
3RD GRADE
99.9/ 100
METRIC RATING
45th/ 347
METRIC RANK
96.3%
3RD GRADE
0.0/ 100
METRIC RATING
330th/ 347
METRIC RANK
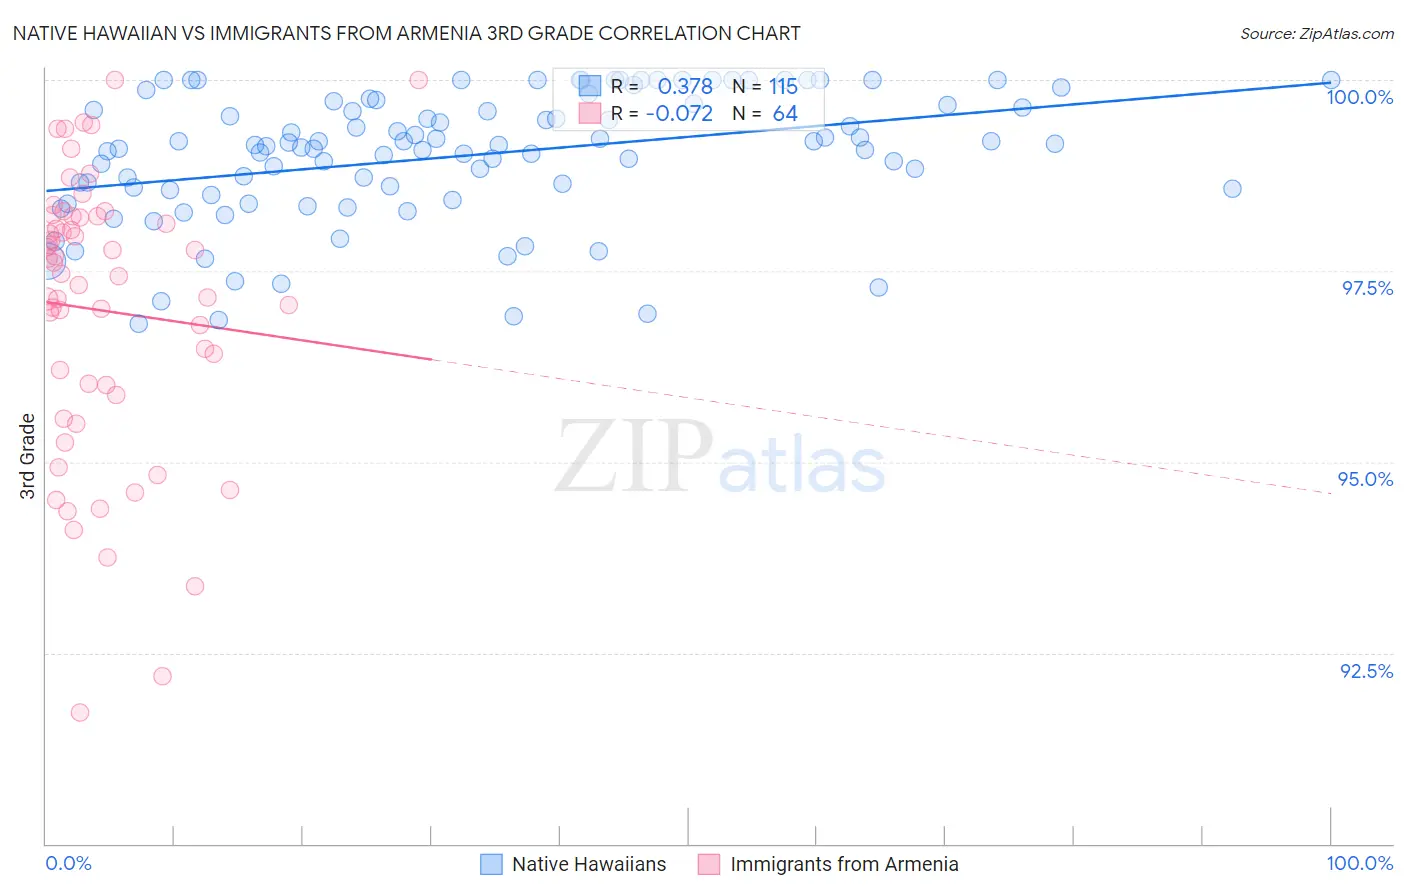
Native Hawaiian vs Immigrants from Armenia 3rd Grade Correlation Chart
The statistical analysis conducted on geographies consisting of 332,114,626 people shows a mild positive correlation between the proportion of Native Hawaiians and percentage of population with at least 3rd grade education in the United States with a correlation coefficient (R) of 0.378 and weighted average of 98.3%. Similarly, the statistical analysis conducted on geographies consisting of 97,725,276 people shows a slight negative correlation between the proportion of Immigrants from Armenia and percentage of population with at least 3rd grade education in the United States with a correlation coefficient (R) of -0.072 and weighted average of 96.3%, a difference of 2.1%.
3rd Grade Correlation Summary
| Measurement | Native Hawaiian | Immigrants from Armenia |
| Minimum | 96.8% | 91.7% |
| Maximum | 100.0% | 100.0% |
| Range | 3.2% | 8.3% |
| Mean | 99.0% | 97.0% |
| Median | 99.1% | 97.5% |
| Interquartile 25% (IQ1) | 98.6% | 95.9% |
| Interquartile 75% (IQ3) | 99.7% | 98.2% |
| Interquartile Range (IQR) | 1.1% | 2.3% |
| Standard Deviation (Sample) | 0.84% | 1.8% |
| Standard Deviation (Population) | 0.83% | 1.8% |
Similar Demographics by 3rd Grade
Demographics Similar to Native Hawaiians by 3rd Grade
In terms of 3rd grade, the demographic groups most similar to Native Hawaiians are Hungarian (98.3%, a difference of 0.0%), Northern European (98.3%, a difference of 0.010%), Luxembourger (98.3%, a difference of 0.020%), Belgian (98.3%, a difference of 0.020%), and Ottawa (98.3%, a difference of 0.020%).
| Demographics | Rating | Rank | 3rd Grade |
| Chippewa | 99.9 /100 | #38 | Exceptional 98.4% |
| Latvians | 99.9 /100 | #39 | Exceptional 98.4% |
| Eastern Europeans | 99.9 /100 | #40 | Exceptional 98.3% |
| Luxembourgers | 99.9 /100 | #41 | Exceptional 98.3% |
| Belgians | 99.9 /100 | #42 | Exceptional 98.3% |
| Northern Europeans | 99.9 /100 | #43 | Exceptional 98.3% |
| Hungarians | 99.9 /100 | #44 | Exceptional 98.3% |
| Native Hawaiians | 99.9 /100 | #45 | Exceptional 98.3% |
| Ottawa | 99.8 /100 | #46 | Exceptional 98.3% |
| Czechoslovakians | 99.8 /100 | #47 | Exceptional 98.3% |
| Lumbee | 99.8 /100 | #48 | Exceptional 98.3% |
| Estonians | 99.8 /100 | #49 | Exceptional 98.3% |
| Celtics | 99.8 /100 | #50 | Exceptional 98.3% |
| Australians | 99.8 /100 | #51 | Exceptional 98.3% |
| Whites/Caucasians | 99.8 /100 | #52 | Exceptional 98.3% |
Demographics Similar to Immigrants from Armenia by 3rd Grade
In terms of 3rd grade, the demographic groups most similar to Immigrants from Armenia are Immigrants from Latin America (96.2%, a difference of 0.010%), Mexican (96.2%, a difference of 0.020%), Immigrants from Fiji (96.2%, a difference of 0.050%), Immigrants from Cambodia (96.2%, a difference of 0.070%), and Immigrants from Dominican Republic (96.2%, a difference of 0.070%).
| Demographics | Rating | Rank | 3rd Grade |
| Hondurans | 0.0 /100 | #323 | Tragic 96.5% |
| Dominicans | 0.0 /100 | #324 | Tragic 96.4% |
| Mexican American Indians | 0.0 /100 | #325 | Tragic 96.4% |
| Immigrants | Vietnam | 0.0 /100 | #326 | Tragic 96.4% |
| Japanese | 0.0 /100 | #327 | Tragic 96.4% |
| Bangladeshis | 0.0 /100 | #328 | Tragic 96.3% |
| Immigrants | Honduras | 0.0 /100 | #329 | Tragic 96.3% |
| Immigrants | Armenia | 0.0 /100 | #330 | Tragic 96.3% |
| Immigrants | Latin America | 0.0 /100 | #331 | Tragic 96.2% |
| Mexicans | 0.0 /100 | #332 | Tragic 96.2% |
| Immigrants | Fiji | 0.0 /100 | #333 | Tragic 96.2% |
| Immigrants | Cambodia | 0.0 /100 | #334 | Tragic 96.2% |
| Immigrants | Dominican Republic | 0.0 /100 | #335 | Tragic 96.2% |
| Immigrants | Cabo Verde | 0.0 /100 | #336 | Tragic 96.2% |
| Central Americans | 0.0 /100 | #337 | Tragic 96.1% |