Moroccan vs Menominee Single Father Households
COMPARE
Moroccan
Menominee
Single Father Households
Single Father Households Comparison
Moroccans
Menominee
2.2%
SINGLE FATHER HOUSEHOLDS
96.9/ 100
METRIC RATING
126th/ 347
METRIC RANK
4.2%
SINGLE FATHER HOUSEHOLDS
0.0/ 100
METRIC RATING
345th/ 347
METRIC RANK
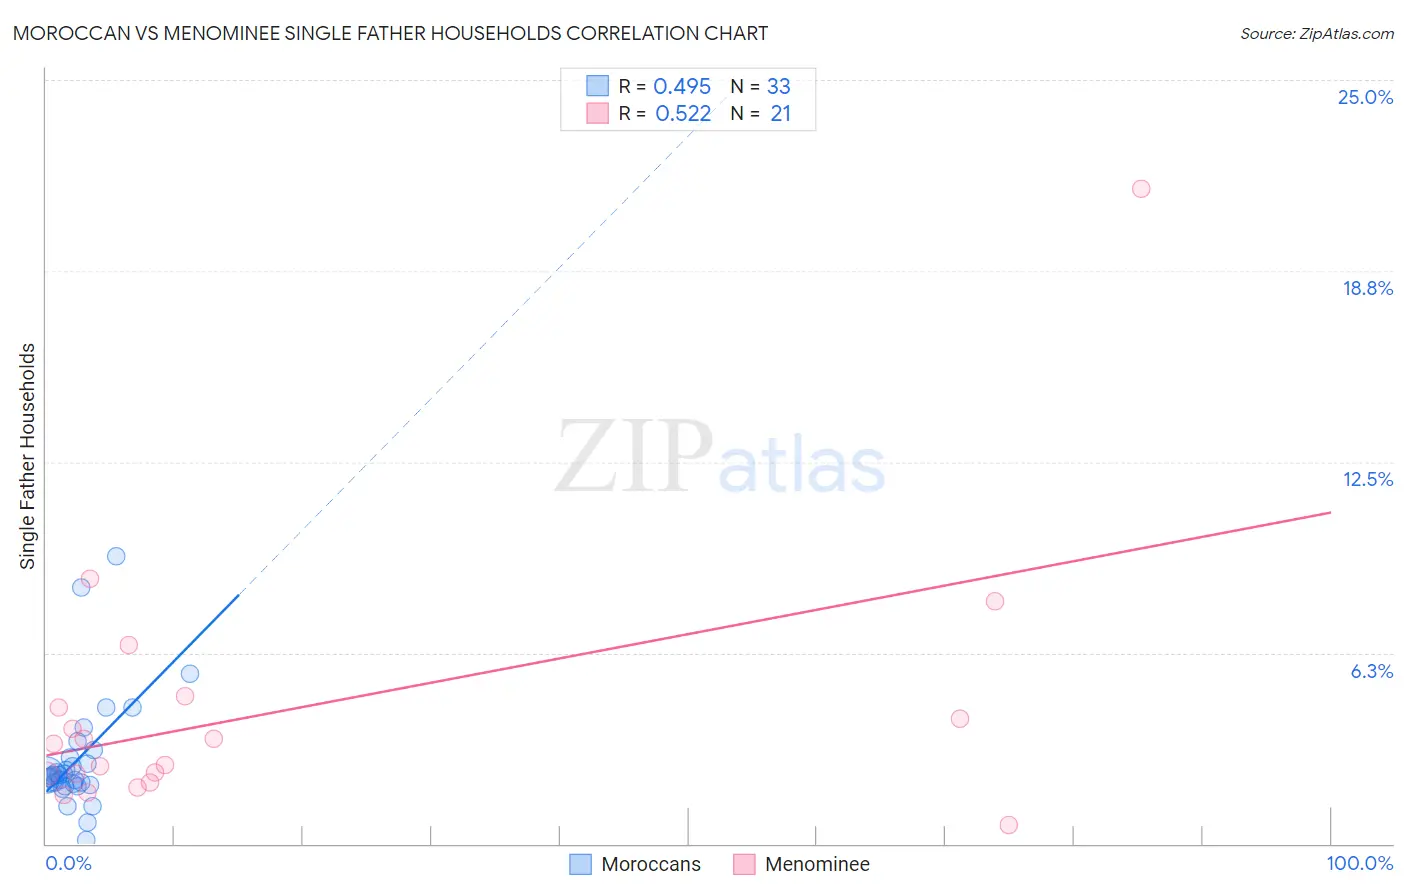
Moroccan vs Menominee Single Father Households Correlation Chart
The statistical analysis conducted on geographies consisting of 201,125,863 people shows a moderate positive correlation between the proportion of Moroccans and percentage of single father households in the United States with a correlation coefficient (R) of 0.495 and weighted average of 2.2%. Similarly, the statistical analysis conducted on geographies consisting of 45,722,024 people shows a substantial positive correlation between the proportion of Menominee and percentage of single father households in the United States with a correlation coefficient (R) of 0.522 and weighted average of 4.2%, a difference of 92.5%.
Single Father Households Correlation Summary
| Measurement | Moroccan | Menominee |
| Minimum | 0.13% | 0.60% |
| Maximum | 9.4% | 21.4% |
| Range | 9.3% | 20.8% |
| Mean | 2.8% | 4.4% |
| Median | 2.3% | 3.3% |
| Interquartile 25% (IQ1) | 1.9% | 2.1% |
| Interquartile 75% (IQ3) | 2.9% | 4.7% |
| Interquartile Range (IQR) | 1.0% | 2.5% |
| Standard Deviation (Sample) | 1.9% | 4.4% |
| Standard Deviation (Population) | 1.9% | 4.3% |
Similar Demographics by Single Father Households
Demographics Similar to Moroccans by Single Father Households
In terms of single father households, the demographic groups most similar to Moroccans are Jordanian (2.2%, a difference of 0.0%), Immigrants from England (2.2%, a difference of 0.050%), Serbian (2.2%, a difference of 0.060%), Immigrants from Chile (2.2%, a difference of 0.17%), and Immigrants from Jordan (2.2%, a difference of 0.23%).
| Demographics | Rating | Rank | Single Father Households |
| Trinidadians and Tobagonians | 97.8 /100 | #119 | Exceptional 2.2% |
| Australians | 97.7 /100 | #120 | Exceptional 2.2% |
| Immigrants | Brazil | 97.7 /100 | #121 | Exceptional 2.2% |
| Immigrants | Iraq | 97.6 /100 | #122 | Exceptional 2.2% |
| Immigrants | Yemen | 97.5 /100 | #123 | Exceptional 2.2% |
| British West Indians | 97.4 /100 | #124 | Exceptional 2.2% |
| Immigrants | Indonesia | 97.4 /100 | #125 | Exceptional 2.2% |
| Moroccans | 96.9 /100 | #126 | Exceptional 2.2% |
| Jordanians | 96.9 /100 | #127 | Exceptional 2.2% |
| Immigrants | England | 96.8 /100 | #128 | Exceptional 2.2% |
| Serbians | 96.8 /100 | #129 | Exceptional 2.2% |
| Immigrants | Chile | 96.7 /100 | #130 | Exceptional 2.2% |
| Immigrants | Jordan | 96.6 /100 | #131 | Exceptional 2.2% |
| Poles | 96.5 /100 | #132 | Exceptional 2.2% |
| Taiwanese | 96.3 /100 | #133 | Exceptional 2.2% |
Demographics Similar to Menominee by Single Father Households
In terms of single father households, the demographic groups most similar to Menominee are Yakama (4.2%, a difference of 0.69%), Pima (4.2%, a difference of 0.93%), Tohono O'odham (3.8%, a difference of 10.2%), Inupiat (4.9%, a difference of 15.3%), and Crow (3.5%, a difference of 19.9%).
| Demographics | Rating | Rank | Single Father Households |
| Natives/Alaskans | 0.0 /100 | #333 | Tragic 3.2% |
| Yuman | 0.0 /100 | #334 | Tragic 3.3% |
| Colville | 0.0 /100 | #335 | Tragic 3.3% |
| Paiute | 0.0 /100 | #336 | Tragic 3.3% |
| Pueblo | 0.0 /100 | #337 | Tragic 3.3% |
| Sioux | 0.0 /100 | #338 | Tragic 3.3% |
| Alaskan Athabascans | 0.0 /100 | #339 | Tragic 3.4% |
| Alaska Natives | 0.0 /100 | #340 | Tragic 3.5% |
| Crow | 0.0 /100 | #341 | Tragic 3.5% |
| Tohono O'odham | 0.0 /100 | #342 | Tragic 3.8% |
| Pima | 0.0 /100 | #343 | Tragic 4.2% |
| Yakama | 0.0 /100 | #344 | Tragic 4.2% |
| Menominee | 0.0 /100 | #345 | Tragic 4.2% |
| Inupiat | 0.0 /100 | #346 | Tragic 4.9% |
| Yup'ik | 0.0 /100 | #347 | Tragic 5.4% |